Detailed Climate Information for USA: Regional Weather Patterns and Data
The United States boasts a diverse climate with varying weather patterns across different regions.
The USA experiences a range of climates including arid deserts in the southwest, humid subtropical climates in the southeast, temperate climates in the northeast, and a marine west coast climate in the Pacific Northwest.
Best Travel Time Guide for USA: Ideal Seasons and Weather Insights
The best time to travel to the USA varies depending on the region. For example, the summer months are ideal for visiting the northeast with its temperate climate, while winter is a great time to explore the ski resorts in the Rocky Mountains.
Detailed Climate in the Regions of USA

Washington D.C.
Region East
The warmest monthly mean temperature occurs in July, at 26.

Albany
The monthly mean temperature is lowest in January, at -3.

Anchorage, Alaska
Monthly mean temperatures reach their low in January, at -6.

Annapolis
Monthly mean temperatures are lowest in January at 2.

Augusta
The monthly mean temperature is lowest in January, at -5.

Austin
The monthly mean temperature reaches its highest point at 30.

Baton Rouge
The coolest monthly mean temperature occurs in January, at 11.

Bismarck
Monthly mean temperatures reach their highest point in July at 22.

Boise
Monthly mean temperatures are highest in July, at 27.

Carson City
Monthly mean temperatures reach their highest point in July, at 25.

Charleston
The coolest monthly mean temperature is 1.

Cheyenne
The monthly mean temperature is lowest in February, at -2.

Columbia
Temperature varies markedly across the year in the monthly averages: the coolest is January at 1.

Concord
Monthly mean temperatures are coolest in January, at -4.

Death Valley National Park
The coolest monthly mean temperature occurs in December, at 6.


Des Moines
Monthly mean temperature is lowest in January at -5.


Fairbanks, Alaska
Monthly mean temperatures reach their lowest point in January, at -17.

Frankfort
The coolest monthly mean is January at 1.

Harrisburg
Monthly mean temperatures are coolest in January, at -0.

Hartford
The coolest monthly mean temperature occurs in January, at -1.

Helena
The monthly mean temperature is lowest in February, at -6.

Indianapolis
The monthly mean temperature is lowest at -1.


Jefferson City
The monthly mean temperature is lowest in January, at 0.

Juneau
Monthly mean temperature is lowest in February, at -2.

Juneau, Alaska
The monthly mean temperature is lowest at -2.


Lincoln
Temperature has a clear annual range in the monthly averages: the lowest mean is -2.

Little Rock
Monthly mean temperatures are warmest in July, at 27.


Montgomery
Monthly mean temperatures are lowest in January, at 8.

Montpelier
The coolest monthly mean temperature occurs in January, at -7.

Nashville
Monthly mean temperatures are lowest in January at 3.

Oklahoma City
Monthly mean temperature is lowest in January, at 4.

Olympia
Monthly mean temperatures are lowest in December, at 4.

Pierre
The coolest monthly mean is January at -5.

Providence
The temperature figures are monthly means, not daytime highs: the coolest monthly mean is January at -0.

Raleigh
Monthly mean temperatures are lowest in January, at 5.

Richmond
The monthly mean temperature is coolest in January, at 10.

Sacramento
Monthly mean temperatures peak in July at 25.

Salem
Monthly mean temperature reaches its high in August, at 21.

Salt Lake City
Monthly mean temperatures are lowest in January, at -1.

Saint Paul
Monthly mean temperatures range from -9.

Santa Fe
January has the lowest monthly mean temperature, at -2.

Springfield
Monthly mean temperatures reach their lowest point in January, at -1.

Tallahassee
The monthly mean temperature is highest in July / August, at 26.


Trenton
The monthly mean temperature is lowest in January, at 0.

Wainwright, Alaska
February has the lowest monthly mean temperature at -23.
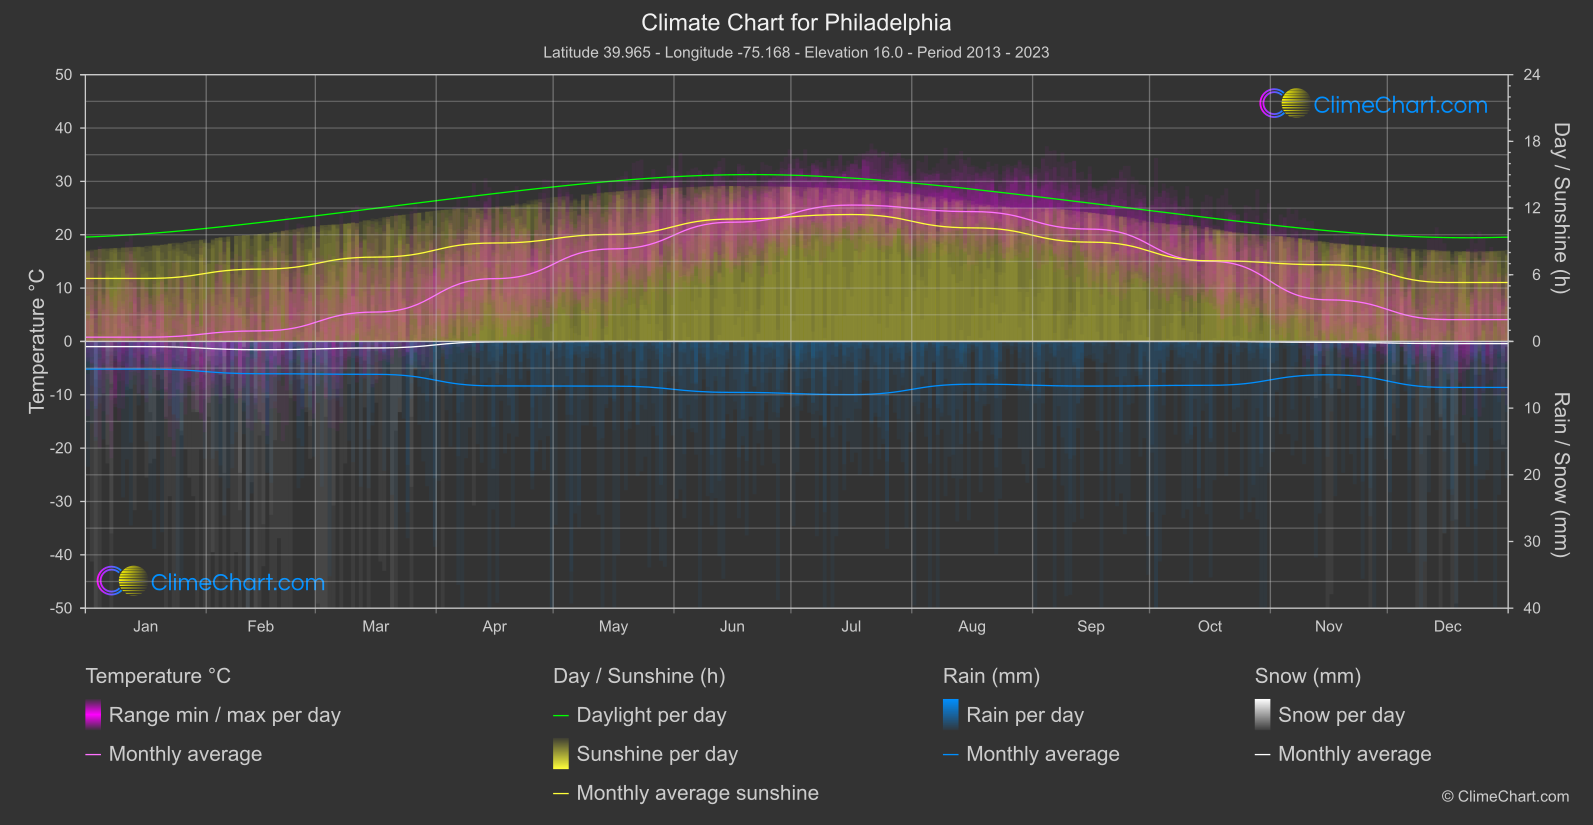
Philadelphia
Region East
Monthly mean temperature is lowest in January at 0.

San Antonio
Region South
January has the lowest monthly mean temperature, 11.

Marshall Islands
Region South-East
Monthly mean temperatures range from February at 26.

Maui
Region South-West
Monthly mean temperatures are highest in August at 26.

San Diego
Region South-West
The monthly mean temperature reaches its highest point in August at 21.

Phoenix
Region West
Monthly mean temperatures are coolest in January, at 11.

Breckenridge
Region Central
The coolest monthly mean temperature occurs in January at -2.

Kirkwood
Region Central
Monthly mean temperature is lowest in January, at 0.

New York City
Region East
Monthly mean temperature is coolest in January, at -0.

Atlanta
Region East
Monthly mean temperatures range from a low of 6.

Chicago
Region North
Monthly mean temperatures range from a low of -3.

Beaver Creek
Region North
The monthly mean temperature is lowest in January, at -7.

Park City
Region North
January has the lowest monthly mean temperature, -9.

Boston
Region North-East
Monthly mean temperature is lowest in January, at -1.

Martha's Vineyard
Region North-East
The coolest monthly mean temperatures occur in January / February, at 1.

Big Sky Ski-Resort
Region North-West
The warmest monthly mean is 19.

Jackson Hole
Region North-West
The monthly mean temperature is highest in July, at 19.

Powder Mountain
Region North-West
Monthly mean temperatures are lowest in February at -4.

Stevens Pass
Region North-West
The monthly mean temperature is lowest in December, at -3.

Whitefish Mountain
Region North-West
The monthly mean temperature is lowest at -4.

Wolf Creek
Region North-West
Monthly mean temperature is lowest at -4.

Houston
Region South
Monthly mean temperatures are lowest at 11.

dallas
Region South
Monthly mean temperatures are lowest in January, at 8.

Miami
Region South-East
Monthly mean temperatures are lowest in January, at 20.

Orlando
Region South-East
Monthly mean temperatures are lowest in January at 15.

Honolulu
Region South-West
Monthly mean temperatures are lowest in February, at 22.

Oahu (Hawaii)
Region South-West
Monthly mean temperatures are highest in August / September and 25.

Hawaii Big Island
Region South-West
The coolest monthly mean temperature is in February, at 9.

Kauai (Hawaii)
Region South-West
February has the lowest monthly mean temperature, at 21.

Maui (Hawaii)
Region South-West
Monthly mean temperatures remain warm throughout the year, with the lowest monthly mean shared by January / February at 22.

Las Vegas
Region West
Monthly mean temperatures are lowest in December at 8.

Los Angeles
Region West
Monthly mean temperature reaches its high in August at 24.

San Francisco
Region West
Monthly mean temperature reaches its lowest point in January, at 10.

San Jose
Region West
The warmest monthly mean is 20.

Alta
Region West
The monthly mean temperature is lowest in January at 12.

Arapahoe Basin
Region West
Monthly mean temperature is lowest in January, at -14.

Aspen Snowmass
Region West
December has the lowest monthly mean temperature, -6.

Copper Mountain
Region West
Monthly mean temperature is lowest at -9.

Crested Butte
Region West
Monthly mean temperatures are lowest in January, at -7.

Heavenly
Region West
Monthly mean temperatures reach their supplied high of 15.

Snowbird
Region West
The warmest monthly mean temperature is 18.

Sun Valley
Region West
The monthly mean temperature is warmest in July, at 25.
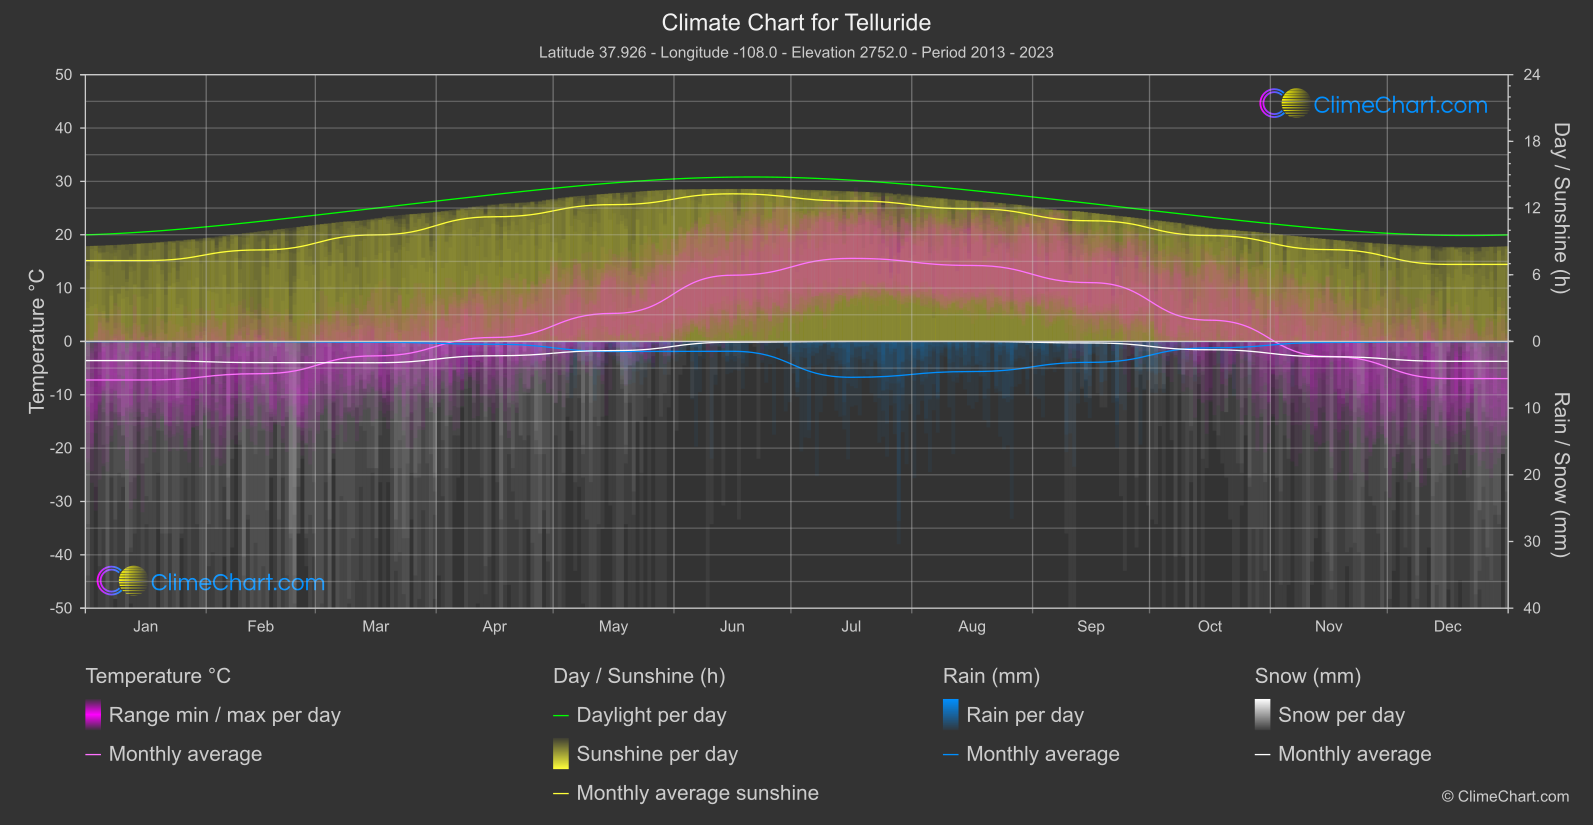
Telluride
Region West
Monthly mean temperatures are lowest in January, at -7.

Vail
Region West
Monthly mean temperature is lowest in December, at -7.