Climate Change Chart of Maldives, Maldives
Comprehensive Climate Change Chart of Maldives, Maldives: Monthly Averages and Impact Trends
Exploring the changing climate in Maldives, with a focus on temperature, rainfall, and sunshine duration.
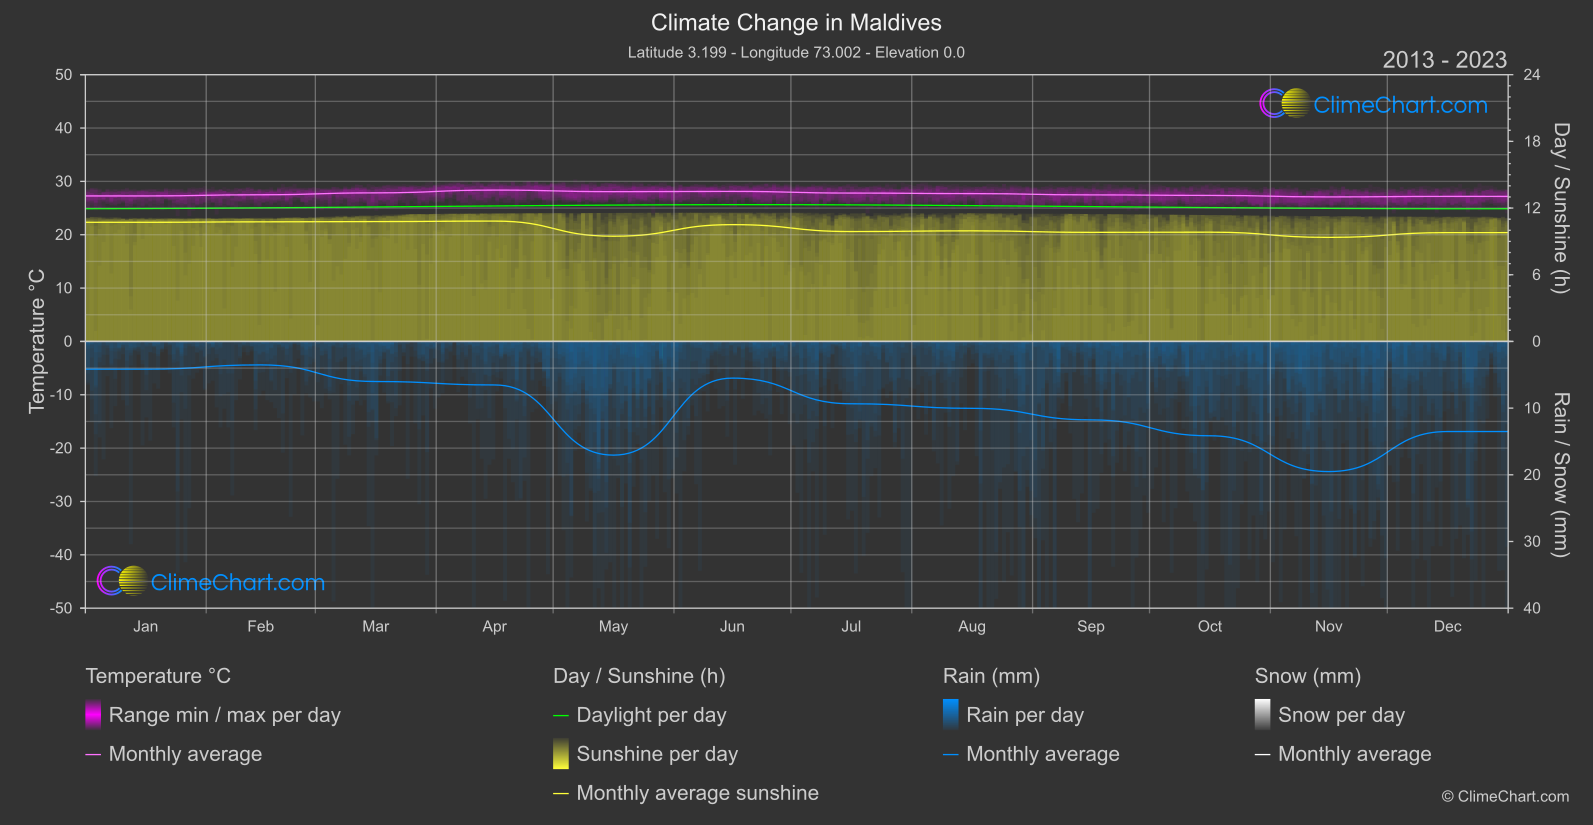
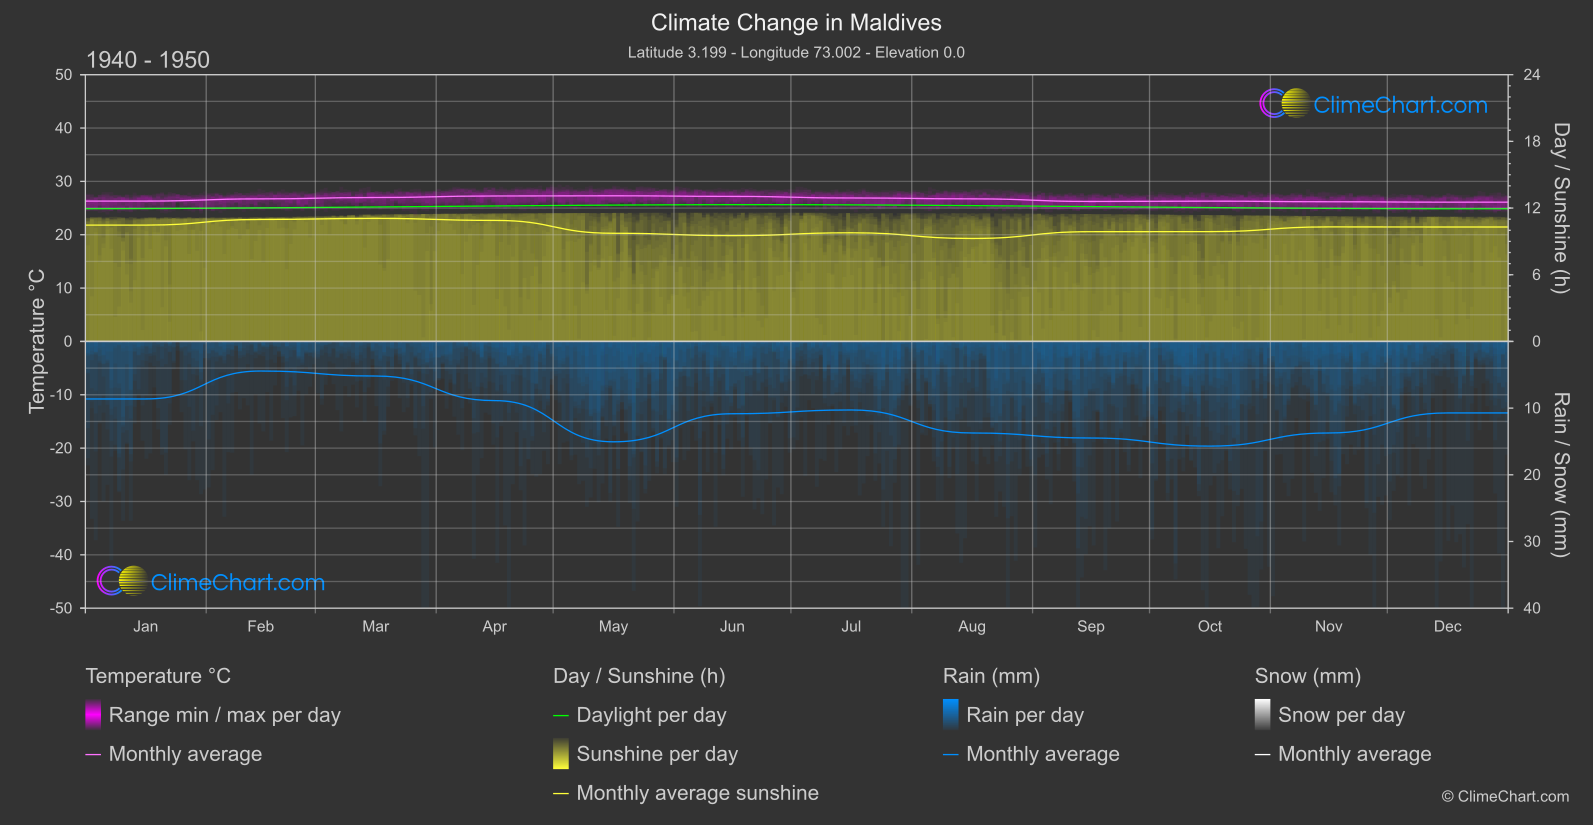
The climate in Maldives has been experiencing noticeable changes over the years. The data from the 1940s to 1950s compared to recent years from 2013 to 2024 reveals significant shifts in temperature, rainfall, and sunshine duration. For instance, the month of September shows a substantial increase in temperature of 1.23°C, while November experiences a significant rise in rainfall by 2.89mm. Additionally, June sees a notable spike in sunshine duration by 0.99 hours.
Climate Change Data Overview for Maldives, Maldives
Explore the comprehensive climate change data for Maldives, Maldives. This detailed table provides valuable insights into temperature variations, precipitation levels, and seasonal changes influenced by climate change, helping you understand the unique weather patterns of this region.
Temperature °C
| Month | ⌀ 1940 - 1950 | ⌀ 2013 - 2023 | +/- |
|---|---|---|---|
| Jan | 26.31 | 27.27 | 0.97 |
| Feb | 26.72 | 27.49 | 0.77 |
| Mar | 26.98 | 27.85 | 0.87 |
| Apr | 27.26 | 28.37 | 1.10 |
| May | 27.30 | 28.07 | 0.77 |
| Jun | 27.19 | 28.12 | 0.93 |
| Jul | 26.89 | 27.81 | 0.92 |
| Aug | 26.73 | 27.71 | 0.98 |
| Sep | 26.24 | 27.47 | 1.23 |
| Oct | 26.29 | 27.37 | 1.08 |
| Nov | 26.18 | 27.09 | 0.91 |
| Dec | 26.10 | 27.19 | 1.08 |
| ⌀ Month | 26.68 | 27.65 | 0.97 |
Sunshine (h)
| Month | ⌀ 1940 - 1950 | ⌀ 2013 - 2023 | +/- |
|---|---|---|---|
| Jan | 10.47 | 10.72 | 0.25 |
| Feb | 10.97 | 10.76 | -0.21 |
| Mar | 11.07 | 10.78 | -0.29 |
| Apr | 10.89 | 10.83 | -0.06 |
| May | 9.73 | 9.47 | -0.26 |
| Jun | 9.52 | 10.51 | 0.99 |
| Jul | 9.77 | 9.89 | 0.11 |
| Aug | 9.26 | 9.95 | 0.69 |
| Sep | 9.87 | 9.81 | -0.06 |
| Oct | 9.88 | 9.83 | -0.05 |
| Nov | 10.30 | 9.36 | -0.94 |
| Dec | 10.30 | 9.79 | -0.51 |
| ⌀ Month | 10.17 | 10.14 | -0.03 |
Rain (mm)
| Month | ⌀ 1940 - 1950 | ⌀ 2013 - 2023 | +/- |
|---|---|---|---|
| Jan | 4.31 | 2.08 | -2.23 |
| Feb | 2.22 | 1.76 | -0.46 |
| Mar | 2.59 | 3.01 | 0.41 |
| Apr | 4.44 | 3.26 | -1.17 |
| May | 7.53 | 8.52 | 1.00 |
| Jun | 5.42 | 2.75 | -2.67 |
| Jul | 5.14 | 4.67 | -0.47 |
| Aug | 6.86 | 5.02 | -1.85 |
| Sep | 7.24 | 5.88 | -1.36 |
| Oct | 7.85 | 7.07 | -0.77 |
| Nov | 6.86 | 9.76 | 2.89 |
| Dec | 5.36 | 6.75 | 1.39 |
| ⌀ Month | 5.49 | 5.05 | -0.44 |
Snow (mm)
| Month | ⌀ 1940 - 1950 | ⌀ 2013 - 2023 | +/- |
|---|---|---|---|
| Jan | 0.00 | 0.00 | 0.00 |
| Feb | 0.00 | 0.00 | 0.00 |
| Mar | 0.00 | 0.00 | 0.00 |
| Apr | 0.00 | 0.00 | 0.00 |
| May | 0.00 | 0.00 | 0.00 |
| Jun | 0.00 | 0.00 | 0.00 |
| Jul | 0.00 | 0.00 | 0.00 |
| Aug | 0.00 | 0.00 | 0.00 |
| Sep | 0.00 | 0.00 | 0.00 |
| Oct | 0.00 | 0.00 | 0.00 |
| Nov | 0.00 | 0.00 | 0.00 |
| Dec | 0.00 | 0.00 | 0.00 |
| ⌀ Month | 0.00 | 0.00 | 0.00 |