Climate Chart of Maldives, Maldives
Comprehensive Climate Chart of Maldives, Maldives: Monthly Averages and Weather Trends
Discover the tropical paradise of Maldives, an archipelago of 26 atolls in the Indian Ocean. With its crystal-clear waters, white sandy beaches, and vibrant marine life, Maldives is a dream destination for sun-seekers and water enthusiasts.
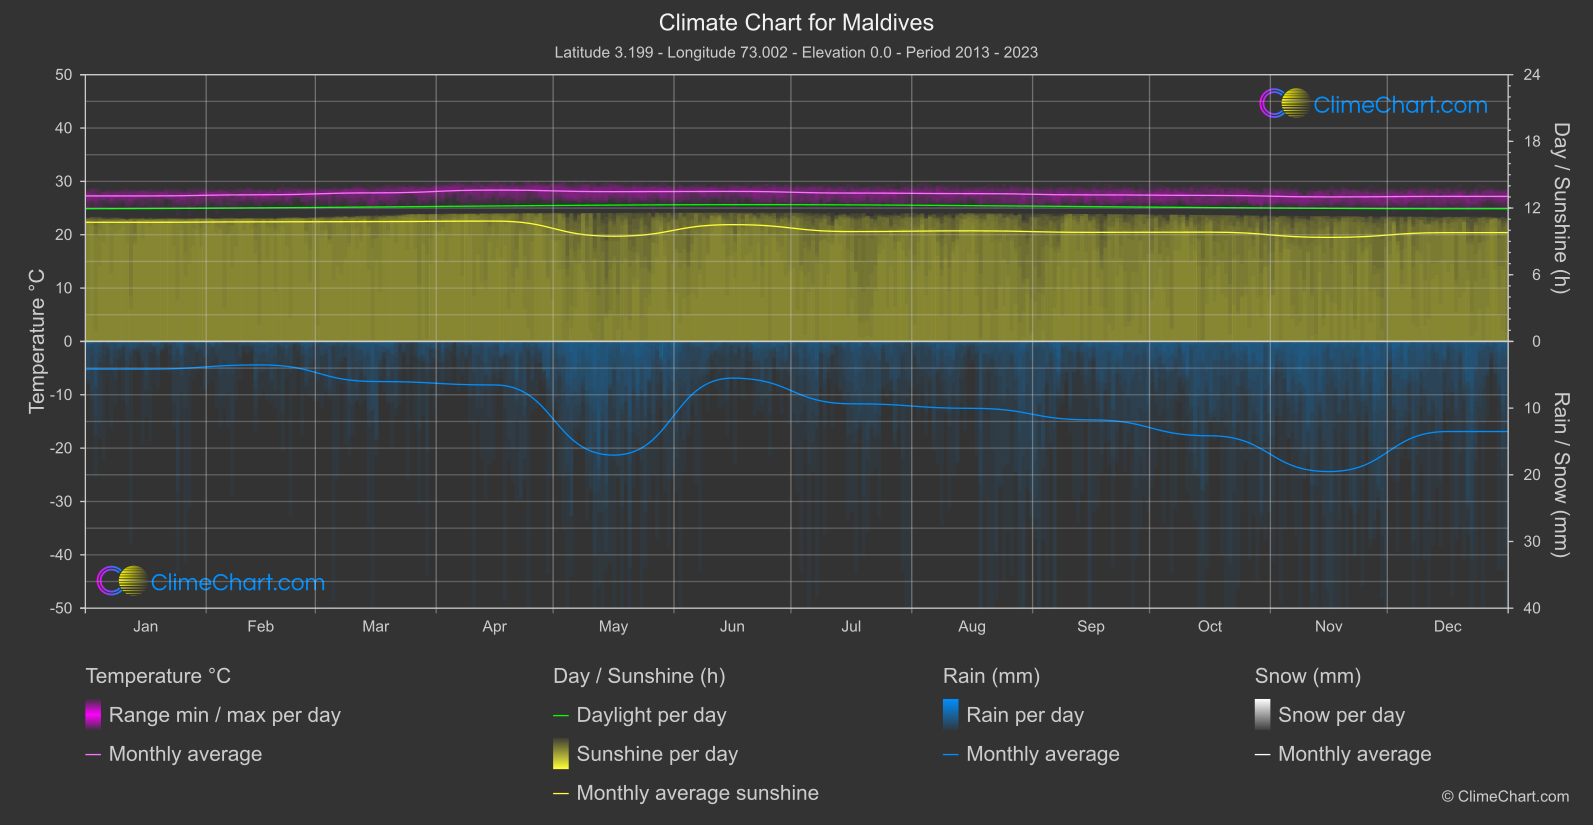
The climate in Maldives is tropical, with two distinct seasons: the dry northeast monsoon from December to March, and the wet southwest monsoon from May to November. The average temperature ranges from 25°C to 31°C year-round. Rainfall is higher during the wet season, but showers are usually short-lived.
Best Travel Time Guide for Maldives, Maldives: Ideal Seasons and Weather Insights
The best time to travel to Maldives is during the dry northeast monsoon season from December to March when the weather is sunny and ideal for beach activities and water sports. For those looking to avoid crowds, consider visiting during the shoulder months of April and November. Remember to pack light clothing, sunscreen, and a good book for relaxation by the sea.
Climate Data Overview for Maldives, Maldives
Explore the comprehensive climate data for Maldives, Maldives. This detailed table provides valuable insights into temperature variations, precipitation levels, and seasonal changes, helping you understand the unique weather patterns of this region.
| Month | ⌀ Temperature °C | ⌀ Rain (mm) | ⌀ Snow (mm) | ⌀ Sunshine (h) |
|---|---|---|---|---|
| Jan | 27.3 | 2.08 | 0.00 | 10.72 |
| Feb | 27.5 | 1.76 | 0.00 | 10.76 |
| Mar | 27.8 | 3.01 | 0.00 | 10.78 |
| Apr | 28.4 | 3.26 | 0.00 | 10.83 |
| May | 28.1 | 8.52 | 0.00 | 9.47 |
| Jun | 28.1 | 2.75 | 0.00 | 10.51 |
| Jul | 27.8 | 4.67 | 0.00 | 9.89 |
| Aug | 27.7 | 5.02 | 0.00 | 9.95 |
| Sep | 27.5 | 5.88 | 0.00 | 9.81 |
| Oct | 27.4 | 7.07 | 0.00 | 9.83 |
| Nov | 27.1 | 9.76 | 0.00 | 9.36 |
| Dec | 27.2 | 6.75 | 0.00 | 9.79 |
| ⌀ Month | 27.7 | 5.04 | 0.00 | 10.14 |