Climate Chart of Majuro, Marshall Islands
Comprehensive Climate Chart of Majuro, Marshall Islands: Monthly Averages and Weather Trends
Discover Majuro, Marshall Islands: A Guide to its Climate and Weather
Majuro, the capital of the Marshall Islands, enjoys a tropical rainforest climate with consistent temperatures throughout the year. The wet season typically falls between May and November, while the dry season spans from December to April. Humidity levels remain high, and occasional showers are common. Majuro experiences an average annual temperature of around 28°C (82°F), making it an ideal destination for beach lovers and water sports enthusiasts.
Best Travel Time Guide for Majuro, Marshall Islands: Ideal Seasons and Weather Insights
The best time to visit Majuro is during the dry season from December to April when the weather is sunny and ideal for outdoor activities. It is recommended to avoid the wet season if you prefer to enjoy the beaches and clear waters. Plan your trip to Majuro during the dry months for a memorable and enjoyable experience.
Climate Data Overview for Majuro, Marshall Islands
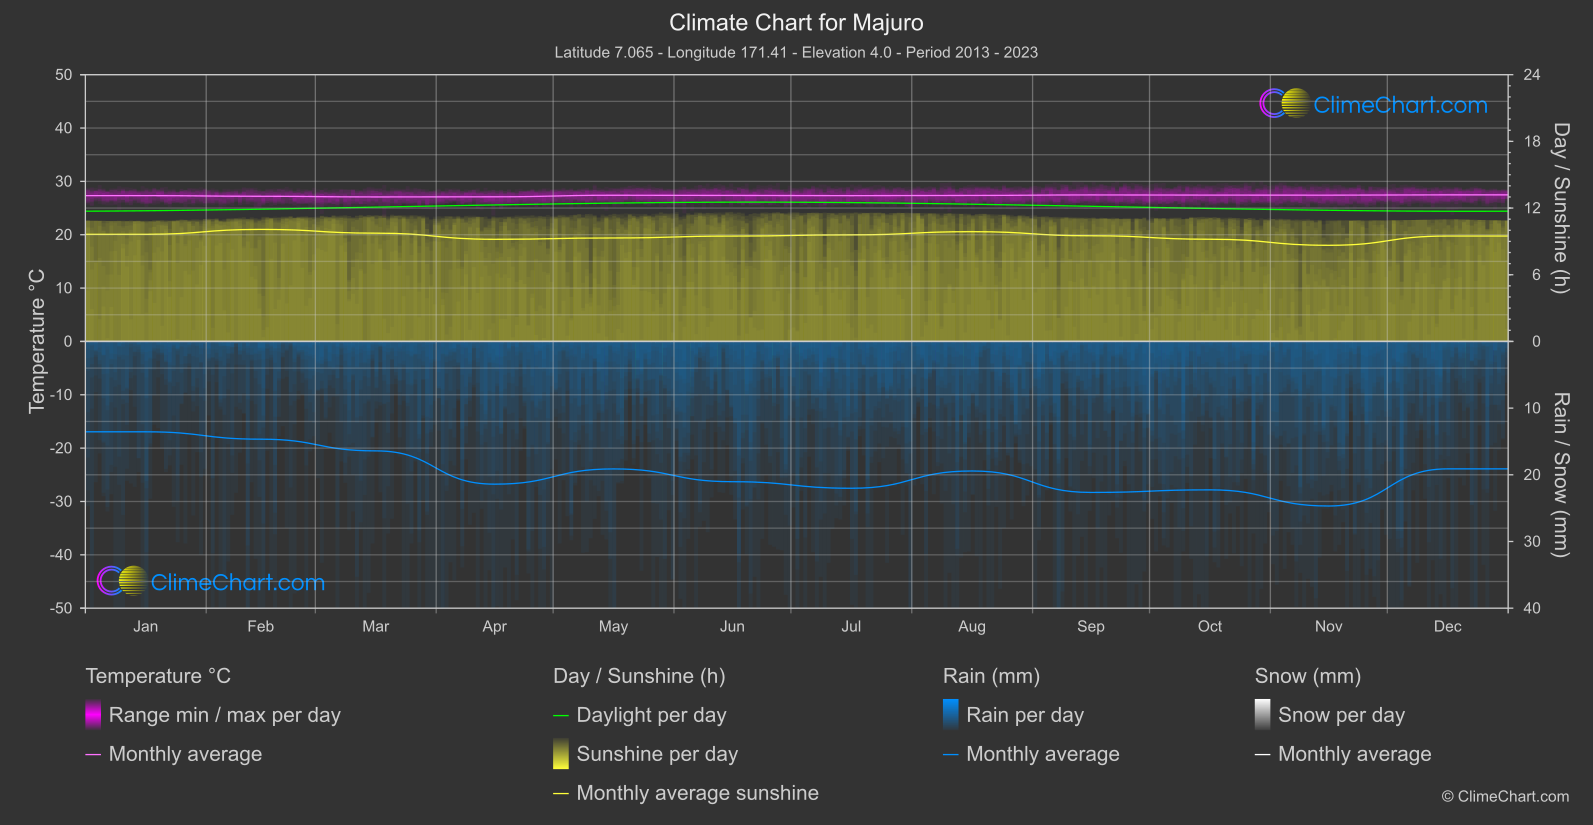
Explore the comprehensive climate data for Majuro, Marshall Islands. This detailed table provides valuable insights into temperature variations, precipitation levels, and seasonal changes, helping you understand the unique weather patterns of this region.
| Month | ⌀ Temperature °C | ⌀ Rain (mm) | ⌀ Snow (mm) | ⌀ Sunshine (h) |
|---|---|---|---|---|
| Jan | 27.3 | 6.78 | 0.00 | 9.64 |
| Feb | 27.2 | 7.33 | 0.00 | 10.08 |
| Mar | 27.1 | 8.21 | 0.00 | 9.74 |
| Apr | 27.1 | 10.70 | 0.00 | 9.19 |
| May | 27.4 | 9.56 | 0.00 | 9.31 |
| Jun | 27.4 | 10.52 | 0.00 | 9.48 |
| Jul | 27.3 | 11.01 | 0.00 | 9.59 |
| Aug | 27.4 | 9.71 | 0.00 | 9.88 |
| Sep | 27.5 | 11.32 | 0.00 | 9.51 |
| Oct | 27.4 | 11.13 | 0.00 | 9.19 |
| Nov | 27.4 | 12.34 | 0.00 | 8.65 |
| Dec | 27.5 | 9.55 | 0.00 | 9.48 |
| ⌀ Month | 27.3 | 9.85 | 0.00 | 9.48 |