Climate Change Chart of Majuro, Marshall Islands
Comprehensive Climate Change Chart of Majuro, Marshall Islands: Monthly Averages and Impact Trends
Explore the changing climate trends in Majuro, Marshall Islands with insights on temperature, rainfall, and sunshine duration. Discover how the climate has evolved from 1940 - 1950 to 2013 - 2024.
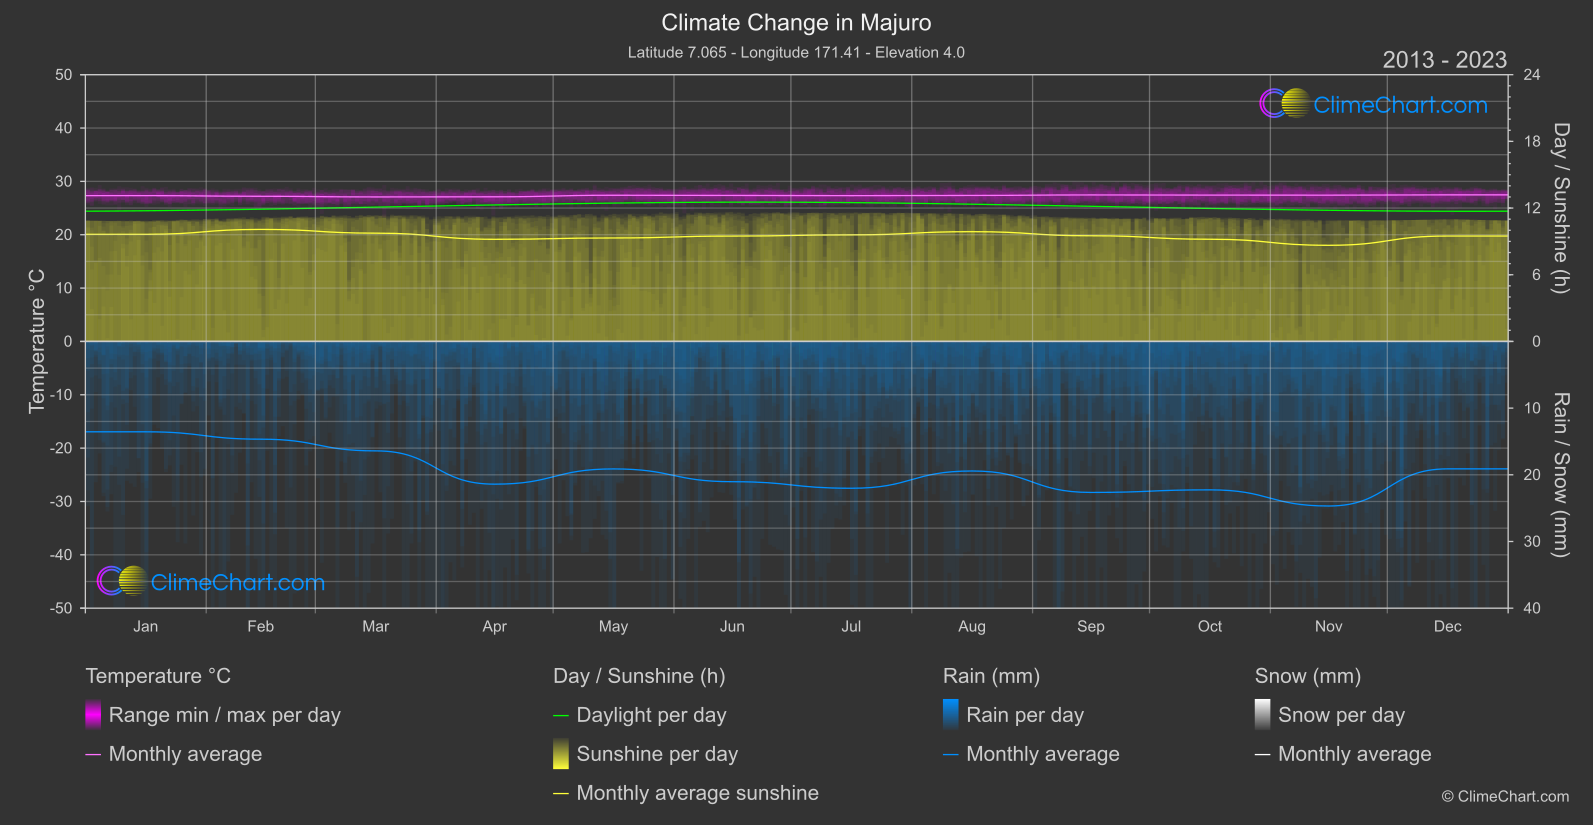
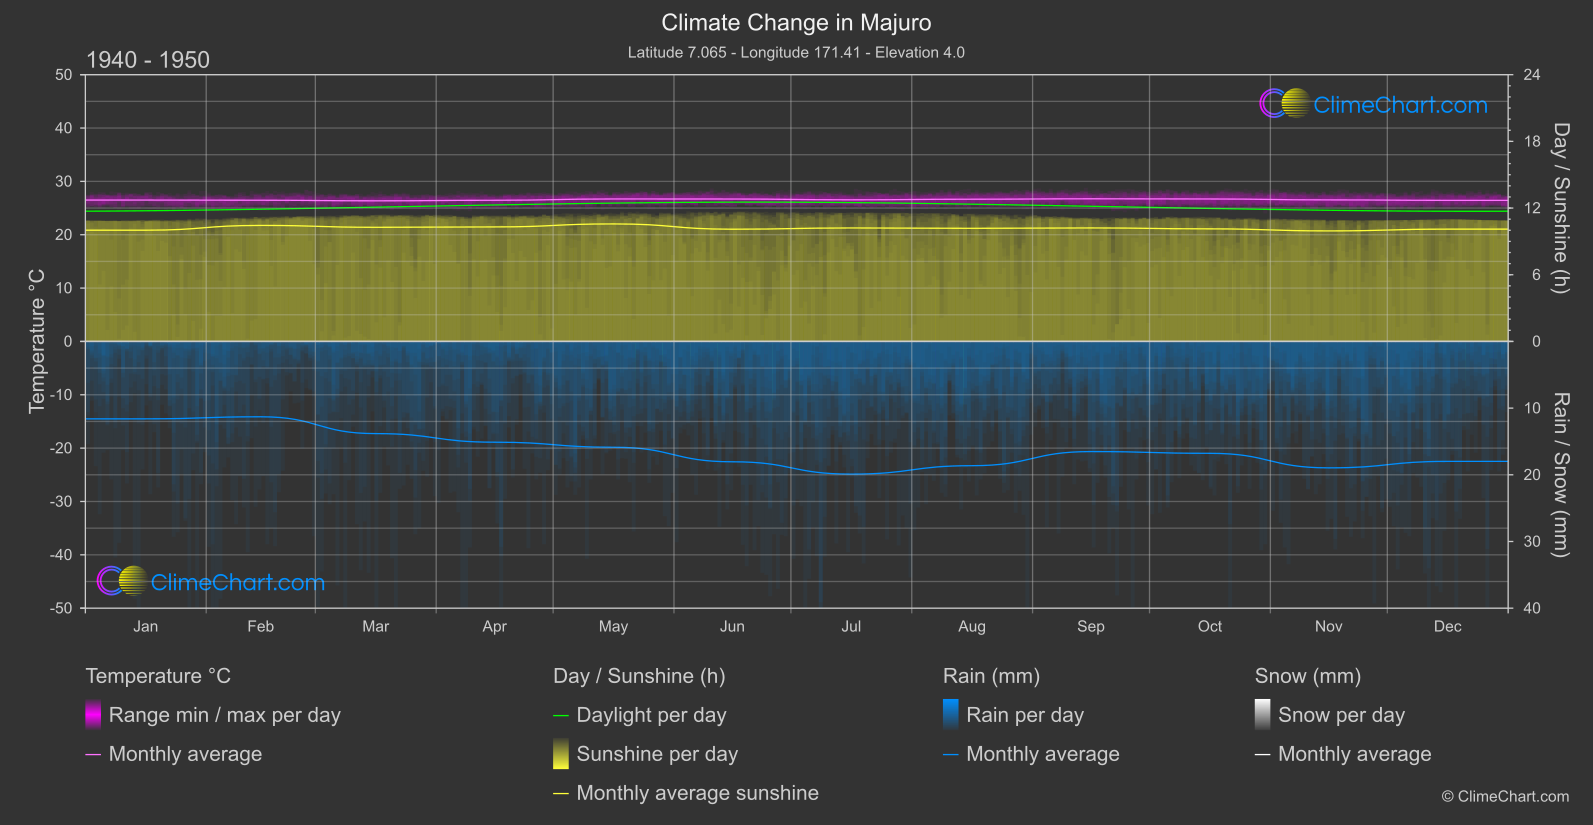
Majuro, Marshall Islands experiences a noticeable increase in temperature and rainfall from 1940 - 1950 to 2013 - 2024. The data reveals that December has the highest temperature change of approximately 1.03°C, while April shows the largest increase in rainfall with a change of around 3.15mm. Furthermore, the sunshine duration has decreased across all months, with November witnessing the most significant reduction of about 1.29 hours.
Climate Change Data Overview for Majuro, Marshall Islands
Explore the comprehensive climate change data for Majuro, Marshall Islands. This detailed table provides valuable insights into temperature variations, precipitation levels, and seasonal changes influenced by climate change, helping you understand the unique weather patterns of this region.
Temperature °C
| Month | ⌀ 1940 - 1950 | ⌀ 2013 - 2023 | +/- |
|---|---|---|---|
| Jan | 26.50 | 27.33 | 0.83 |
| Feb | 26.47 | 27.21 | 0.74 |
| Mar | 26.35 | 27.09 | 0.73 |
| Apr | 26.46 | 27.11 | 0.65 |
| May | 26.70 | 27.40 | 0.70 |
| Jun | 26.69 | 27.37 | 0.67 |
| Jul | 26.54 | 27.32 | 0.78 |
| Aug | 26.66 | 27.37 | 0.71 |
| Sep | 26.74 | 27.46 | 0.72 |
| Oct | 26.70 | 27.43 | 0.73 |
| Nov | 26.53 | 27.42 | 0.89 |
| Dec | 26.44 | 27.47 | 1.03 |
| ⌀ Month | 26.57 | 27.33 | 0.77 |
Sunshine (h)
| Month | ⌀ 1940 - 1950 | ⌀ 2013 - 2023 | +/- |
|---|---|---|---|
| Jan | 10.01 | 9.64 | -0.37 |
| Feb | 10.44 | 10.08 | -0.36 |
| Mar | 10.27 | 9.74 | -0.53 |
| Apr | 10.30 | 9.19 | -1.11 |
| May | 10.57 | 9.31 | -1.26 |
| Jun | 10.10 | 9.48 | -0.62 |
| Jul | 10.21 | 9.59 | -0.62 |
| Aug | 10.18 | 9.88 | -0.30 |
| Sep | 10.21 | 9.51 | -0.70 |
| Oct | 10.13 | 9.19 | -0.93 |
| Nov | 9.94 | 8.65 | -1.29 |
| Dec | 10.10 | 9.48 | -0.62 |
| ⌀ Month | 10.21 | 9.48 | -0.73 |
Rain (mm)
| Month | ⌀ 1940 - 1950 | ⌀ 2013 - 2023 | +/- |
|---|---|---|---|
| Jan | 5.80 | 6.78 | 0.97 |
| Feb | 5.65 | 7.33 | 1.68 |
| Mar | 6.91 | 8.21 | 1.30 |
| Apr | 7.56 | 10.70 | 3.15 |
| May | 7.93 | 9.56 | 1.63 |
| Jun | 9.02 | 10.52 | 1.49 |
| Jul | 9.95 | 11.01 | 1.06 |
| Aug | 9.32 | 9.71 | 0.40 |
| Sep | 8.26 | 11.32 | 3.06 |
| Oct | 8.39 | 11.13 | 2.74 |
| Nov | 9.48 | 12.34 | 2.86 |
| Dec | 8.99 | 9.55 | 0.56 |
| ⌀ Month | 8.11 | 9.85 | 1.74 |
Snow (mm)
| Month | ⌀ 1940 - 1950 | ⌀ 2013 - 2023 | +/- |
|---|---|---|---|
| Jan | 0.00 | 0.00 | 0.00 |
| Feb | 0.00 | 0.00 | 0.00 |
| Mar | 0.00 | 0.00 | 0.00 |
| Apr | 0.00 | 0.00 | 0.00 |
| May | 0.00 | 0.00 | 0.00 |
| Jun | 0.00 | 0.00 | 0.00 |
| Jul | 0.00 | 0.00 | 0.00 |
| Aug | 0.00 | 0.00 | 0.00 |
| Sep | 0.00 | 0.00 | 0.00 |
| Oct | 0.00 | 0.00 | 0.00 |
| Nov | 0.00 | 0.00 | 0.00 |
| Dec | 0.00 | 0.00 | 0.00 |
| ⌀ Month | 0.00 | 0.00 | 0.00 |