Climate Chart of Djibouti, Djibouti
Comprehensive Climate Chart of Djibouti, Djibouti: Monthly Averages and Weather Trends
Explore the Climate of Djibouti, Djibouti
Djibouti, located in the Horn of Africa, experiences a hot desert climate characterized by extremely high temperatures and minimal rainfall. The city of Djibouti has an annual average temperature of around 30°C (86°F) and can reach highs of over 40°C (104°F) during the summer months. The weather is generally dry and sunny throughout the year, with little to no rainfall. The best time to visit Djibouti is during the cooler months from November to February when temperatures are more moderate.
Best Travel Time Guide for Djibouti, Djibouti: Ideal Seasons and Weather Insights
The best time to travel to Djibouti is during the cooler months from November to February when temperatures are more moderate. This period offers pleasant weather for exploring the city and its natural attractions without the intense heat of the summer months.
Climate Data Overview for Djibouti, Djibouti
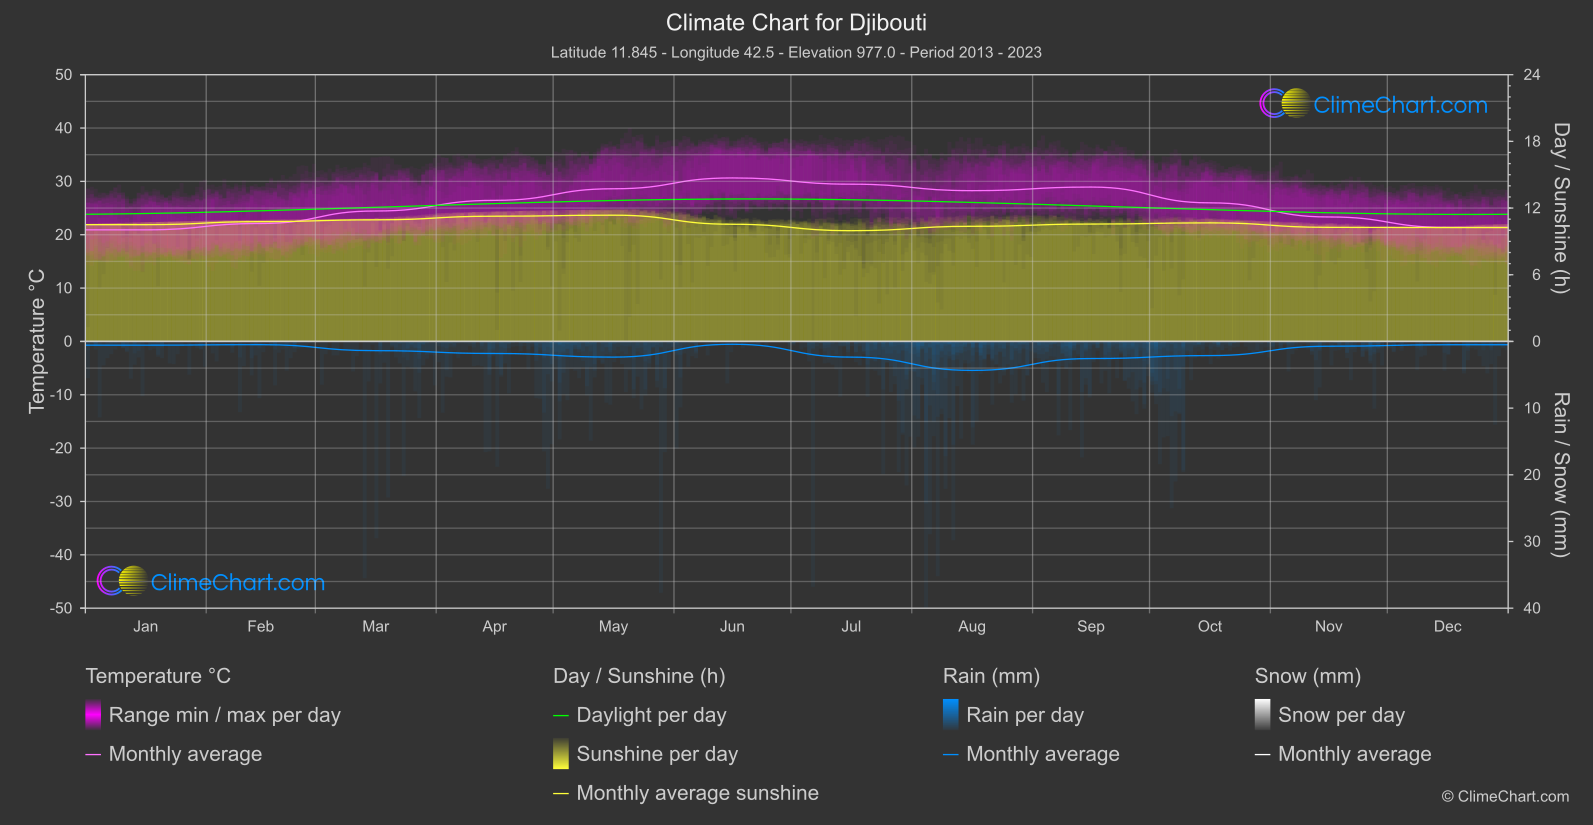
Explore the comprehensive climate data for Djibouti, Djibouti. This detailed table provides valuable insights into temperature variations, precipitation levels, and seasonal changes, helping you understand the unique weather patterns of this region.
| Month | ⌀ Temperature °C | ⌀ Rain (mm) | ⌀ Snow (mm) | ⌀ Sunshine (h) |
|---|---|---|---|---|
| Jan | 20.9 | 0.28 | 0.00 | 10.51 |
| Feb | 22.1 | 0.24 | 0.00 | 10.78 |
| Mar | 24.4 | 0.69 | 0.00 | 10.94 |
| Apr | 26.4 | 0.90 | 0.00 | 11.27 |
| May | 28.6 | 1.18 | 0.00 | 11.36 |
| Jun | 30.6 | 0.21 | 0.00 | 10.54 |
| Jul | 29.5 | 1.18 | 0.00 | 9.96 |
| Aug | 28.3 | 2.17 | 0.00 | 10.36 |
| Sep | 28.9 | 1.28 | 0.00 | 10.56 |
| Oct | 26.0 | 1.06 | 0.00 | 10.67 |
| Nov | 23.3 | 0.36 | 0.00 | 10.26 |
| Dec | 21.4 | 0.25 | 0.00 | 10.25 |
| ⌀ Month | 25.9 | 0.82 | 0.00 | 10.62 |