Climate Change Chart of Djibouti, Djibouti
Comprehensive Climate Change Chart of Djibouti, Djibouti: Monthly Averages and Impact Trends
Exploring the climate change data of Djibouti reveals significant shifts in temperature, rainfall, and sunshine duration over the years.
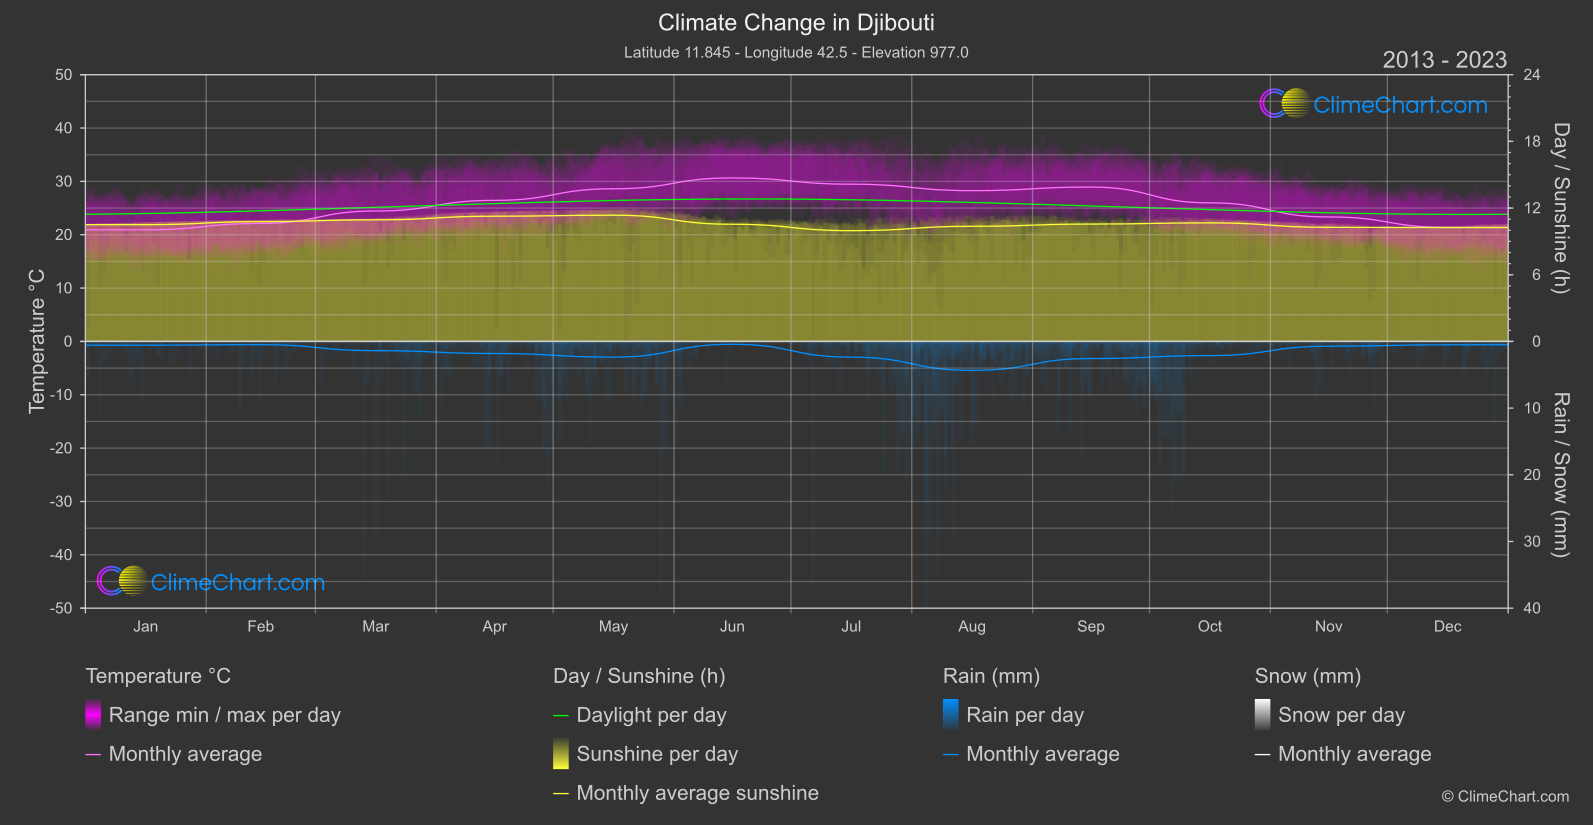
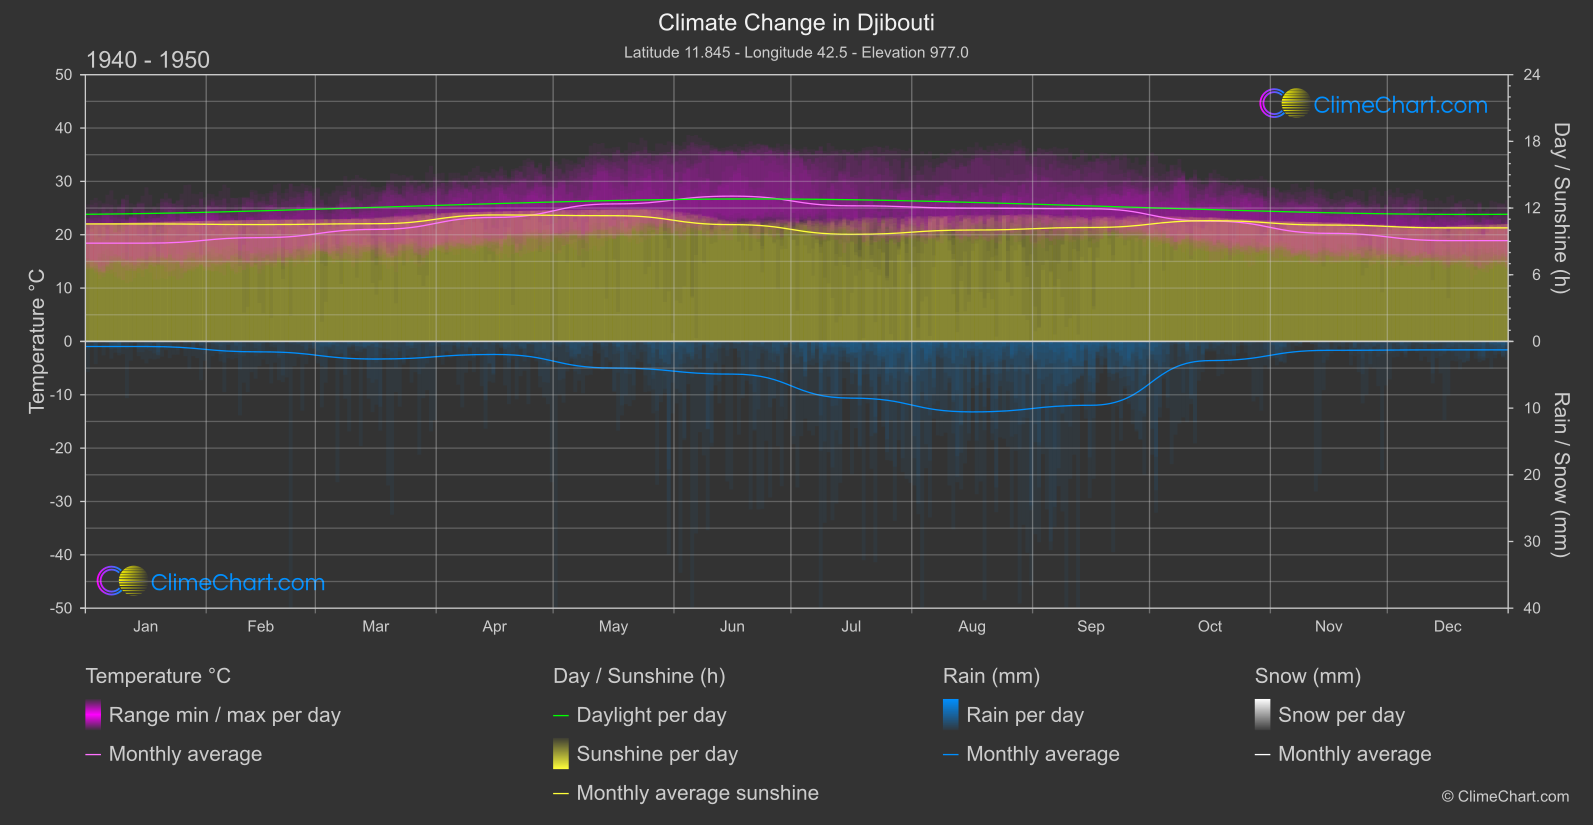
Djibouti, a country known for its arid climate, has experienced noticeable changes in temperature, rainfall, and sunshine duration. Analysis of the data indicates that the month with the highest temperature change is September, with a significant increase of 4.07°C compared to the past. In terms of rainfall, July stands out with a remarkable decrease of 3.07 mm. Additionally, the sunshine duration in March showed the largest positive change of 0.35 hours. These findings underscore the impact of climate change on Djibouti's weather patterns.
Climate Change Data Overview for Djibouti, Djibouti
Explore the comprehensive climate change data for Djibouti, Djibouti. This detailed table provides valuable insights into temperature variations, precipitation levels, and seasonal changes influenced by climate change, helping you understand the unique weather patterns of this region.
Temperature °C
| Month | ⌀ 1940 - 1950 | ⌀ 2013 - 2023 | +/- |
|---|---|---|---|
| Jan | 18.42 | 20.92 | 2.50 |
| Feb | 19.46 | 22.11 | 2.65 |
| Mar | 21.00 | 24.45 | 3.45 |
| Apr | 23.24 | 26.44 | 3.20 |
| May | 25.78 | 28.62 | 2.84 |
| Jun | 27.24 | 30.65 | 3.41 |
| Jul | 25.43 | 29.47 | 4.05 |
| Aug | 24.98 | 28.26 | 3.28 |
| Sep | 24.86 | 28.94 | 4.07 |
| Oct | 22.56 | 25.98 | 3.42 |
| Nov | 20.26 | 23.33 | 3.07 |
| Dec | 18.90 | 21.37 | 2.47 |
| ⌀ Month | 22.68 | 25.88 | 3.20 |
Sunshine (h)
| Month | ⌀ 1940 - 1950 | ⌀ 2013 - 2023 | +/- |
|---|---|---|---|
| Jan | 10.57 | 10.51 | -0.07 |
| Feb | 10.51 | 10.78 | 0.26 |
| Mar | 10.59 | 10.94 | 0.35 |
| Apr | 11.38 | 11.27 | -0.11 |
| May | 11.31 | 11.36 | 0.05 |
| Jun | 10.51 | 10.54 | 0.03 |
| Jul | 9.64 | 9.96 | 0.33 |
| Aug | 10.02 | 10.36 | 0.34 |
| Sep | 10.25 | 10.56 | 0.31 |
| Oct | 10.86 | 10.67 | -0.19 |
| Nov | 10.47 | 10.26 | -0.21 |
| Dec | 10.22 | 10.25 | 0.03 |
| ⌀ Month | 10.53 | 10.62 | 0.09 |
Rain (mm)
| Month | ⌀ 1940 - 1950 | ⌀ 2013 - 2023 | +/- |
|---|---|---|---|
| Jan | 0.38 | 0.28 | -0.10 |
| Feb | 0.78 | 0.24 | -0.54 |
| Mar | 1.32 | 0.69 | -0.63 |
| Apr | 0.98 | 0.90 | -0.07 |
| May | 1.99 | 1.18 | -0.82 |
| Jun | 2.45 | 0.21 | -2.24 |
| Jul | 4.25 | 1.18 | -3.07 |
| Aug | 5.28 | 2.17 | -3.11 |
| Sep | 4.79 | 1.28 | -3.50 |
| Oct | 1.44 | 1.06 | -0.38 |
| Nov | 0.67 | 0.36 | -0.31 |
| Dec | 0.63 | 0.25 | -0.38 |
| ⌀ Month | 2.08 | 0.82 | -1.26 |
Snow (mm)
| Month | ⌀ 1940 - 1950 | ⌀ 2013 - 2023 | +/- |
|---|---|---|---|
| Jan | 0.00 | 0.00 | 0.00 |
| Feb | 0.00 | 0.00 | 0.00 |
| Mar | 0.00 | 0.00 | 0.00 |
| Apr | 0.00 | 0.00 | 0.00 |
| May | 0.00 | 0.00 | 0.00 |
| Jun | 0.00 | 0.00 | 0.00 |
| Jul | 0.00 | 0.00 | 0.00 |
| Aug | 0.00 | 0.00 | 0.00 |
| Sep | 0.00 | 0.00 | 0.00 |
| Oct | 0.00 | 0.00 | 0.00 |
| Nov | 0.00 | 0.00 | 0.00 |
| Dec | 0.00 | 0.00 | 0.00 |
| ⌀ Month | 0.00 | 0.00 | 0.00 |