Climate Chart of Aruba, Aruba
Comprehensive Climate Chart of Aruba, Aruba: Monthly Averages and Weather Trends
Welcome to Aruba, a tropical paradise known for its warm weather and stunning beaches.
Aruba has a tropical marine climate with consistently warm temperatures year-round. The average temperature ranges from 75°F to 88°F (24°C to 31°C). The island experiences very little rainfall, making it a popular destination for sun-seekers. The trade winds help to keep the weather pleasant, providing a constant breeze.
Best Travel Time Guide for Aruba, Aruba: Ideal Seasons and Weather Insights
The best time to visit Aruba is during the dry season, which runs from January to August. This period offers sunny days with minimal rainfall, perfect for beach activities and water sports. The peak tourist season is from December to April when the island sees an influx of visitors escaping the cold weather in their home countries.
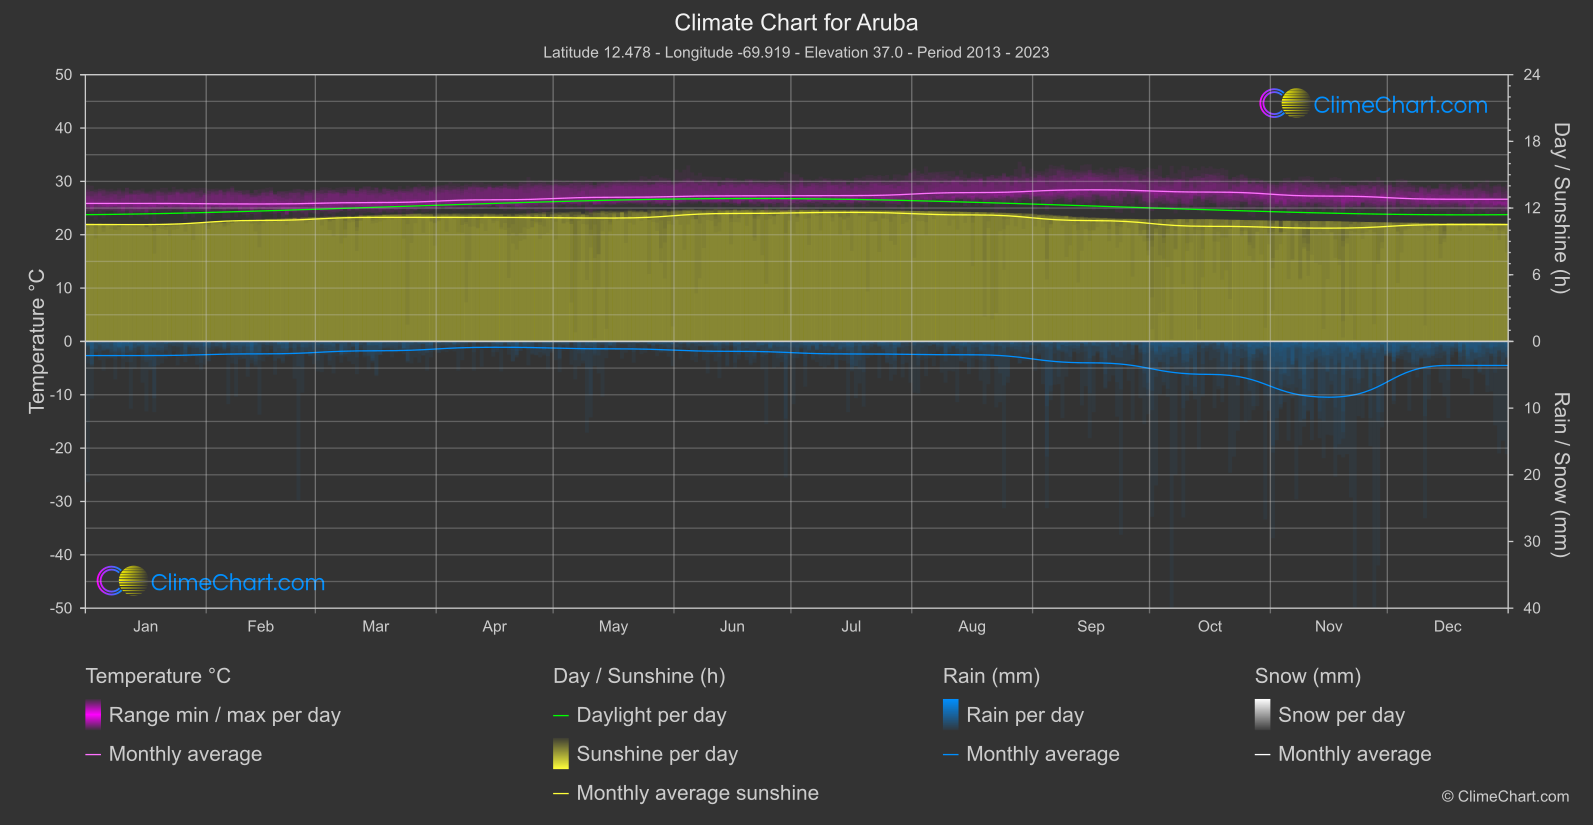
Climate Data Overview for Aruba, Aruba
Explore the comprehensive climate data for Aruba, Aruba. This detailed table provides valuable insights into temperature variations, precipitation levels, and seasonal changes, helping you understand the unique weather patterns of this region.
| Month | ⌀ Temperature °C | ⌀ Rain (mm) | ⌀ Snow (mm) | ⌀ Sunshine (h) |
|---|---|---|---|---|
| Jan | 25.9 | 1.06 | 0.00 | 10.51 |
| Feb | 25.8 | 0.93 | 0.00 | 10.89 |
| Mar | 26.0 | 0.70 | 0.00 | 11.16 |
| Apr | 26.5 | 0.44 | 0.00 | 11.16 |
| May | 27.0 | 0.56 | 0.00 | 11.10 |
| Jun | 27.3 | 0.74 | 0.00 | 11.51 |
| Jul | 27.3 | 0.94 | 0.00 | 11.61 |
| Aug | 27.9 | 1.00 | 0.00 | 11.38 |
| Sep | 28.4 | 1.60 | 0.00 | 10.87 |
| Oct | 28.0 | 2.47 | 0.00 | 10.36 |
| Nov | 27.2 | 4.18 | 0.00 | 10.19 |
| Dec | 26.7 | 1.80 | 0.00 | 10.51 |
| ⌀ Month | 27.0 | 1.37 | 0.00 | 10.94 |