Climate Change Chart of Aruba, Aruba
Comprehensive Climate Change Chart of Aruba, Aruba: Monthly Averages and Impact Trends
Discover the changing climate of Aruba, with data showing temperature, rainfall, and sunshine duration trends. Explore how the climate has evolved over the years and its impact on the island.
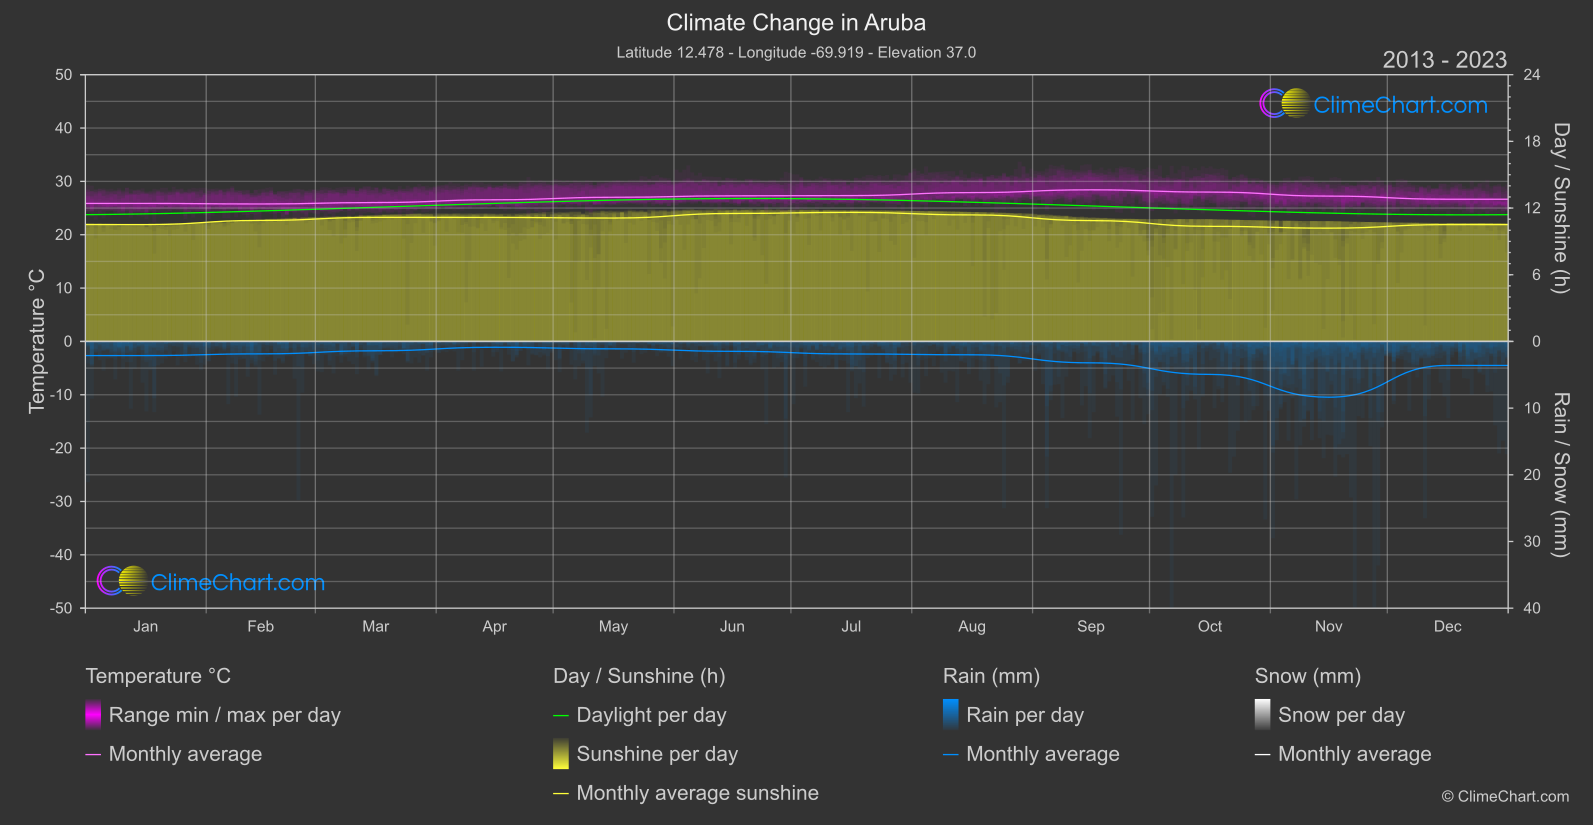
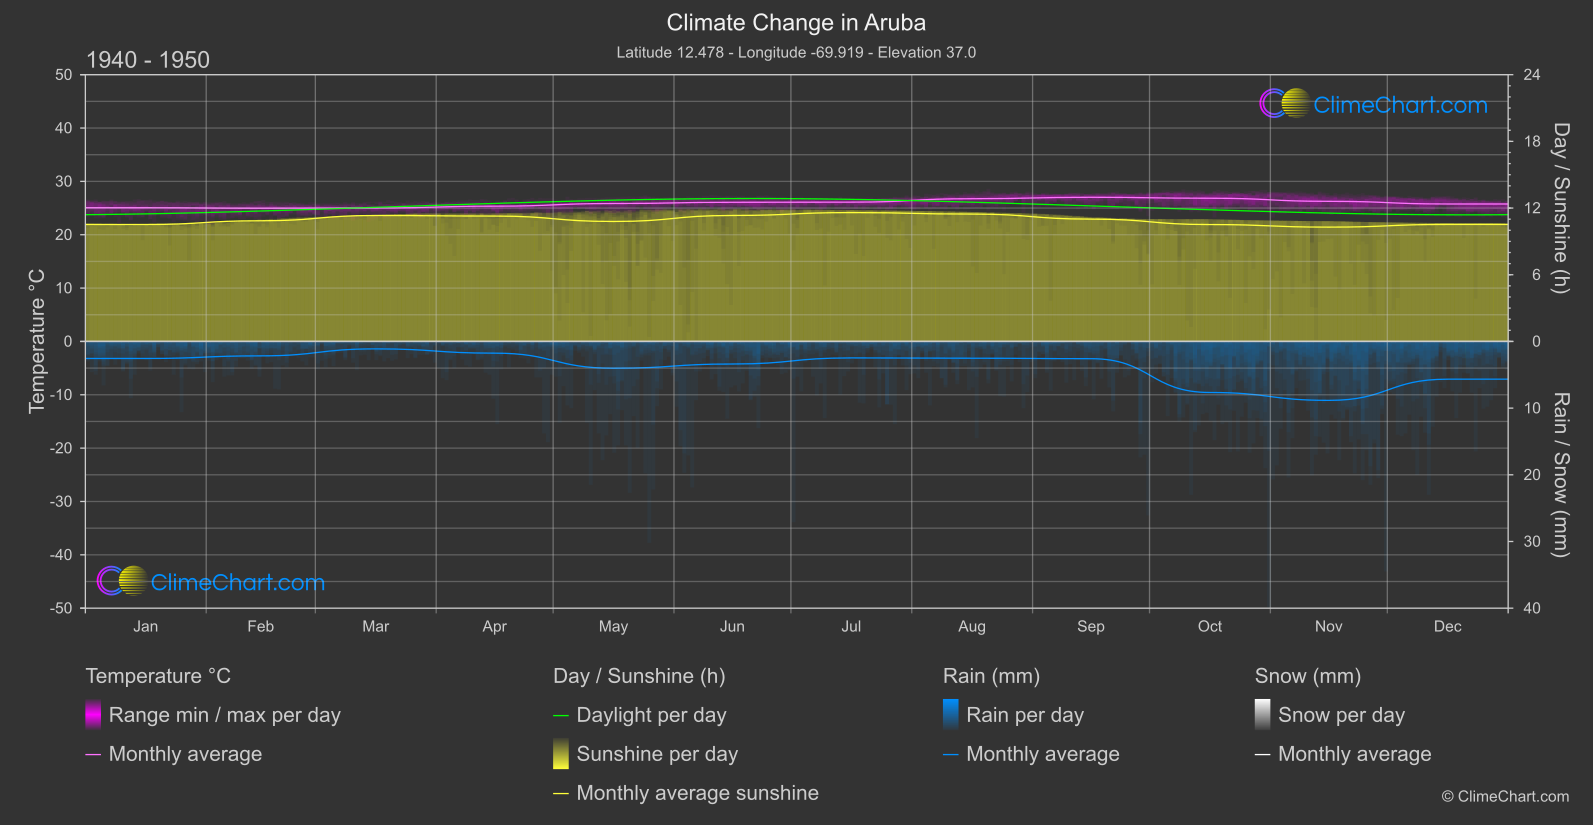
Aruba, a beautiful island in the Caribbean, has been experiencing notable changes in its climate over the years. The data presented here shows the comparison between temperature, rainfall, and sunshine duration from the 1940s to the 1950s to the recent years of 2013 to 2024. The insights reveal interesting patterns, such as temperature increases across most months, with September showing the highest temperature change. Rainfall patterns have also shifted, with some months experiencing a decrease in precipitation. Additionally, sunshine duration has varied, indicating changes in cloud cover and weather patterns. These trends provide valuable information for understanding the evolving climate of Aruba and its potential impacts on the environment and society.
Climate Change Data Overview for Aruba, Aruba
Explore the comprehensive climate change data for Aruba, Aruba. This detailed table provides valuable insights into temperature variations, precipitation levels, and seasonal changes influenced by climate change, helping you understand the unique weather patterns of this region.
Temperature °C
| Month | ⌀ 1940 - 1950 | ⌀ 2013 - 2023 | +/- |
|---|---|---|---|
| Jan | 25.06 | 25.87 | 0.81 |
| Feb | 24.97 | 25.77 | 0.80 |
| Mar | 25.01 | 26.03 | 1.02 |
| Apr | 25.35 | 26.55 | 1.20 |
| May | 25.85 | 27.02 | 1.17 |
| Jun | 26.08 | 27.29 | 1.21 |
| Jul | 26.11 | 27.34 | 1.23 |
| Aug | 26.75 | 27.90 | 1.15 |
| Sep | 27.02 | 28.42 | 1.40 |
| Oct | 26.84 | 28.00 | 1.15 |
| Nov | 26.26 | 27.24 | 0.98 |
| Dec | 25.76 | 26.65 | 0.89 |
| ⌀ Month | 25.92 | 27.01 | 1.08 |
Sunshine (h)
| Month | ⌀ 1940 - 1950 | ⌀ 2013 - 2023 | +/- |
|---|---|---|---|
| Jan | 10.52 | 10.51 | -0.01 |
| Feb | 10.86 | 10.89 | 0.03 |
| Mar | 11.33 | 11.16 | -0.17 |
| Apr | 11.28 | 11.16 | -0.12 |
| May | 10.79 | 11.10 | 0.31 |
| Jun | 11.33 | 11.51 | 0.18 |
| Jul | 11.59 | 11.61 | 0.02 |
| Aug | 11.46 | 11.38 | -0.08 |
| Sep | 11.01 | 10.87 | -0.13 |
| Oct | 10.52 | 10.36 | -0.16 |
| Nov | 10.28 | 10.19 | -0.09 |
| Dec | 10.53 | 10.51 | -0.02 |
| ⌀ Month | 10.96 | 10.94 | -0.02 |
Rain (mm)
| Month | ⌀ 1940 - 1950 | ⌀ 2013 - 2023 | +/- |
|---|---|---|---|
| Jan | 1.28 | 1.06 | -0.22 |
| Feb | 1.08 | 0.93 | -0.15 |
| Mar | 0.56 | 0.70 | 0.14 |
| Apr | 0.88 | 0.44 | -0.44 |
| May | 2.01 | 0.56 | -1.45 |
| Jun | 1.69 | 0.74 | -0.95 |
| Jul | 1.24 | 0.94 | -0.30 |
| Aug | 1.26 | 1.00 | -0.26 |
| Sep | 1.29 | 1.60 | 0.31 |
| Oct | 3.83 | 2.47 | -1.36 |
| Nov | 4.42 | 4.18 | -0.24 |
| Dec | 2.83 | 1.80 | -1.03 |
| ⌀ Month | 1.86 | 1.37 | -0.49 |
Snow (mm)
| Month | ⌀ 1940 - 1950 | ⌀ 2013 - 2023 | +/- |
|---|---|---|---|
| Jan | 0.00 | 0.00 | 0.00 |
| Feb | 0.00 | 0.00 | 0.00 |
| Mar | 0.00 | 0.00 | 0.00 |
| Apr | 0.00 | 0.00 | 0.00 |
| May | 0.00 | 0.00 | 0.00 |
| Jun | 0.00 | 0.00 | 0.00 |
| Jul | 0.00 | 0.00 | 0.00 |
| Aug | 0.00 | 0.00 | 0.00 |
| Sep | 0.00 | 0.00 | 0.00 |
| Oct | 0.00 | 0.00 | 0.00 |
| Nov | 0.00 | 0.00 | 0.00 |
| Dec | 0.00 | 0.00 | 0.00 |
| ⌀ Month | 0.00 | 0.00 | 0.00 |