Climate Change Chart of Dili, Timor-Leste
Comprehensive Climate Change Chart of Dili, Timor-Leste: Monthly Averages and Impact Trends
Explore the changing climate in Dili, Timor-Leste with insightful data analysis. Learn about the trends in temperature, rainfall, and sunshine duration from 1940 to 1950 compared to recent years.
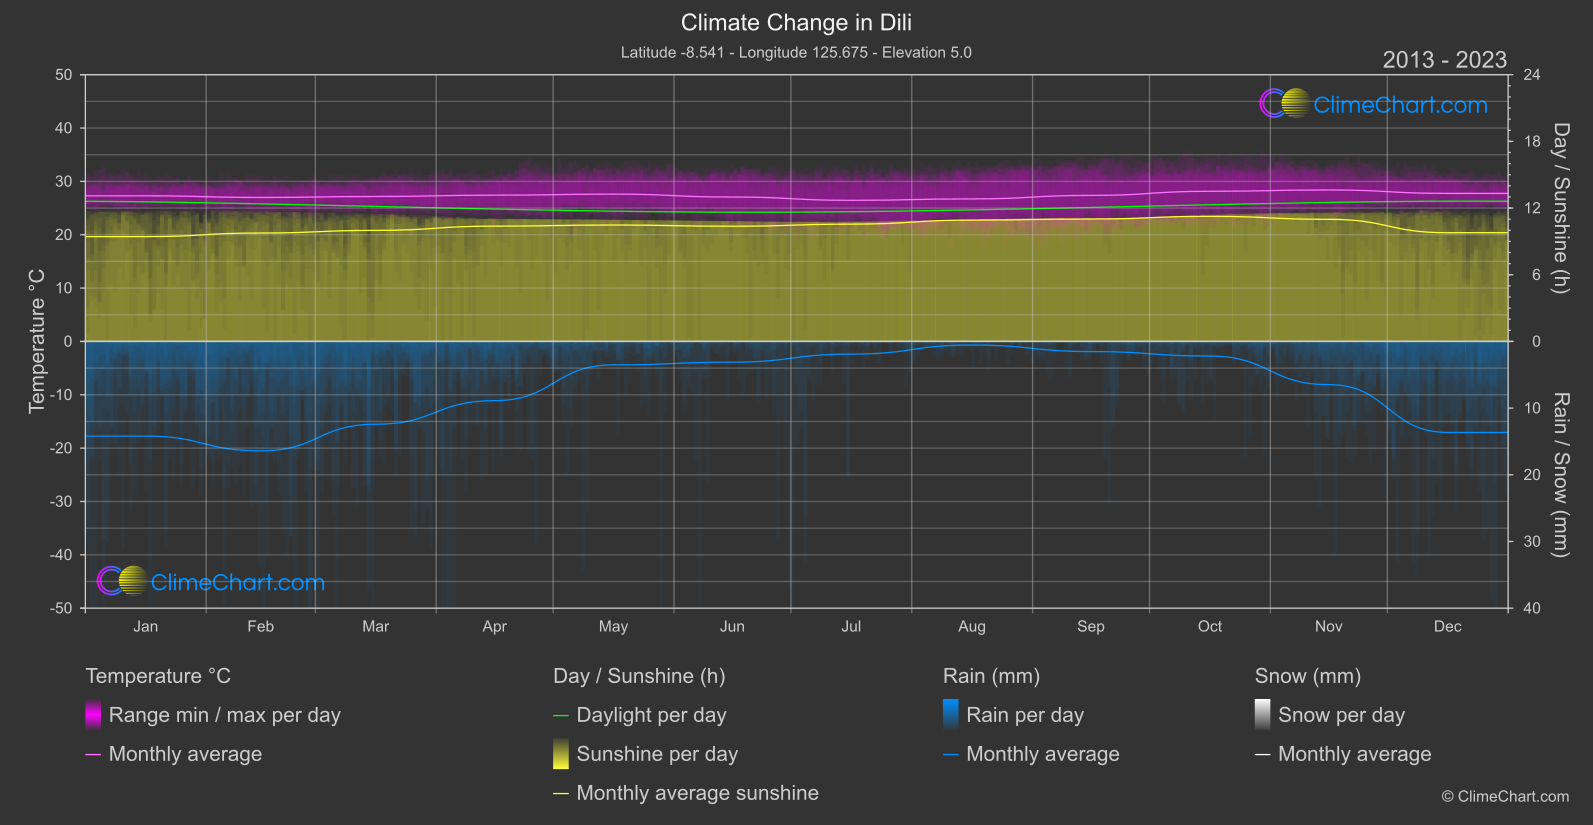
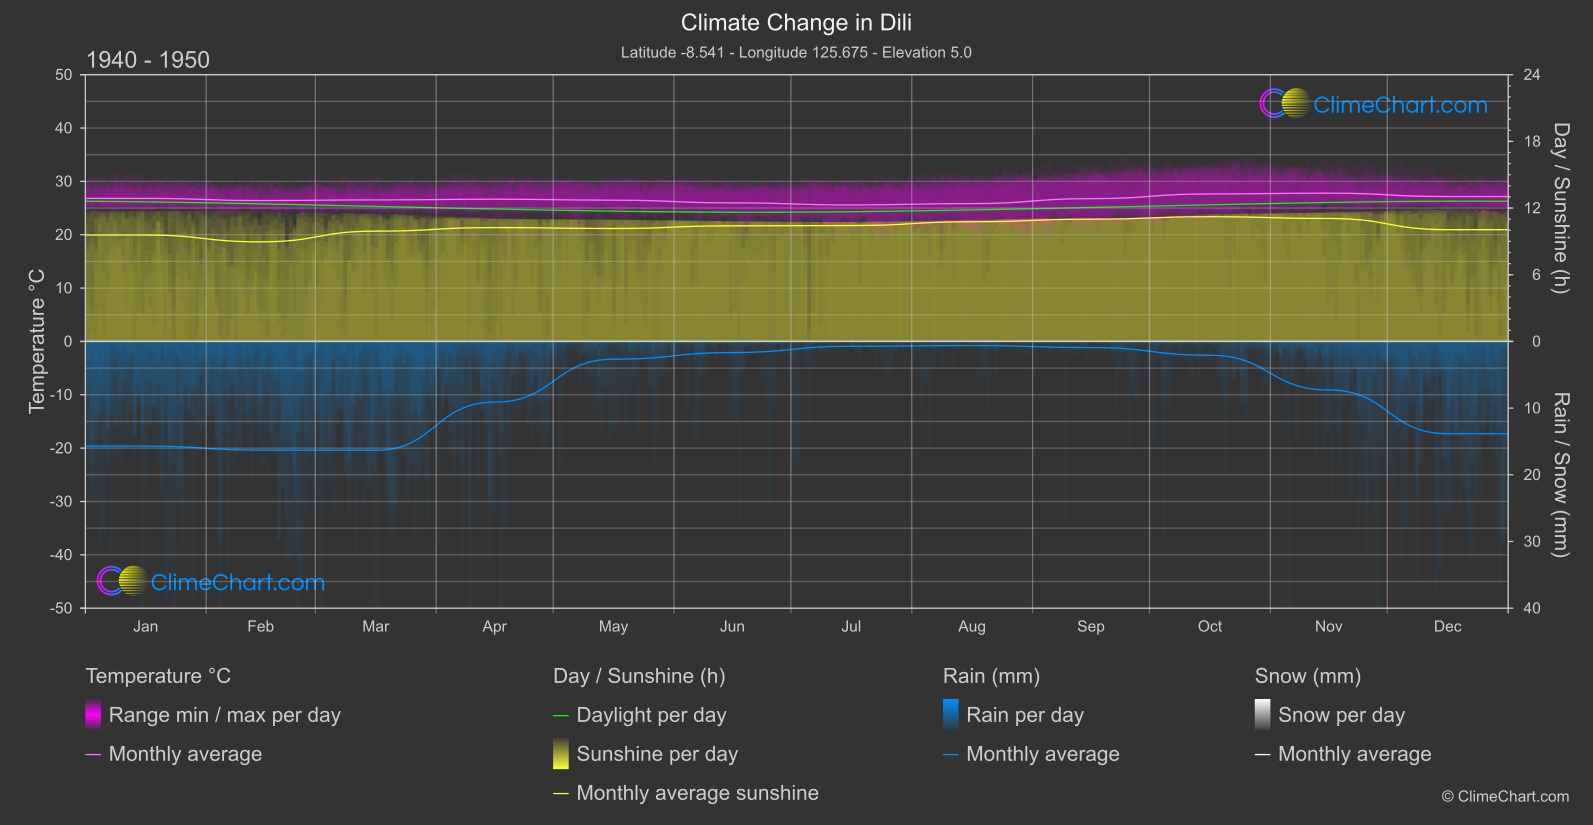
Dili, the capital of Timor-Leste, has experienced notable changes in climate over the past decades. The data reveals interesting insights into temperature variations, rainfall patterns, and sunshine duration. Among the findings, it is observed that the month of May has shown a significant increase in temperature and rainfall. Additionally, the sunshine duration has remained relatively stable throughout the years.
Climate Change Data Overview for Dili, Timor-Leste
Explore the comprehensive climate change data for Dili, Timor-Leste. This detailed table provides valuable insights into temperature variations, precipitation levels, and seasonal changes influenced by climate change, helping you understand the unique weather patterns of this region.
Temperature °C
| Month | ⌀ 1940 - 1950 | ⌀ 2013 - 2023 | +/- |
|---|---|---|---|
| Jan | 26.81 | 27.29 | 0.48 |
| Feb | 26.41 | 26.99 | 0.58 |
| Mar | 26.53 | 27.17 | 0.64 |
| Apr | 26.66 | 27.42 | 0.76 |
| May | 26.48 | 27.61 | 1.13 |
| Jun | 25.97 | 27.07 | 1.10 |
| Jul | 25.58 | 26.45 | 0.86 |
| Aug | 25.84 | 26.72 | 0.88 |
| Sep | 26.76 | 27.37 | 0.61 |
| Oct | 27.64 | 28.14 | 0.50 |
| Nov | 27.79 | 28.39 | 0.60 |
| Dec | 27.16 | 27.75 | 0.59 |
| ⌀ Month | 26.64 | 27.36 | 0.73 |
Sunshine (h)
| Month | ⌀ 1940 - 1950 | ⌀ 2013 - 2023 | +/- |
|---|---|---|---|
| Jan | 9.57 | 9.43 | -0.14 |
| Feb | 8.96 | 9.75 | 0.79 |
| Mar | 9.92 | 9.99 | 0.07 |
| Apr | 10.25 | 10.37 | 0.13 |
| May | 10.16 | 10.47 | 0.31 |
| Jun | 10.40 | 10.36 | -0.04 |
| Jul | 10.43 | 10.55 | 0.13 |
| Aug | 10.77 | 10.92 | 0.15 |
| Sep | 11.00 | 11.02 | 0.02 |
| Oct | 11.22 | 11.25 | 0.03 |
| Nov | 11.06 | 10.99 | -0.08 |
| Dec | 10.06 | 9.78 | -0.28 |
| ⌀ Month | 10.32 | 10.41 | 0.09 |
Rain (mm)
| Month | ⌀ 1940 - 1950 | ⌀ 2013 - 2023 | +/- |
|---|---|---|---|
| Jan | 7.85 | 7.10 | -0.75 |
| Feb | 8.15 | 8.20 | 0.06 |
| Mar | 8.16 | 6.21 | -1.95 |
| Apr | 4.55 | 4.44 | -0.11 |
| May | 1.33 | 1.76 | 0.42 |
| Jun | 0.83 | 1.56 | 0.72 |
| Jul | 0.36 | 0.95 | 0.59 |
| Aug | 0.31 | 0.27 | -0.04 |
| Sep | 0.46 | 0.76 | 0.30 |
| Oct | 1.04 | 1.10 | 0.06 |
| Nov | 3.64 | 3.24 | -0.40 |
| Dec | 6.92 | 6.82 | -0.10 |
| ⌀ Month | 3.63 | 3.53 | -0.10 |
Snow (mm)
| Month | ⌀ 1940 - 1950 | ⌀ 2013 - 2023 | +/- |
|---|---|---|---|
| Jan | 0.00 | 0.00 | 0.00 |
| Feb | 0.00 | 0.00 | 0.00 |
| Mar | 0.00 | 0.00 | 0.00 |
| Apr | 0.00 | 0.00 | 0.00 |
| May | 0.00 | 0.00 | 0.00 |
| Jun | 0.00 | 0.00 | 0.00 |
| Jul | 0.00 | 0.00 | 0.00 |
| Aug | 0.00 | 0.00 | 0.00 |
| Sep | 0.00 | 0.00 | 0.00 |
| Oct | 0.00 | 0.00 | 0.00 |
| Nov | 0.00 | 0.00 | 0.00 |
| Dec | 0.00 | 0.00 | 0.00 |
| ⌀ Month | 0.00 | 0.00 | 0.00 |