Climate Comparison Chart of Washington D.C., USA vs Sharm el-Sheikh, Egypt
Comprehensive Climate Comparison Chart of Washington D.C., USA vs Sharm el-Sheikh, Egypt: Monthly Averages and Impact Trends
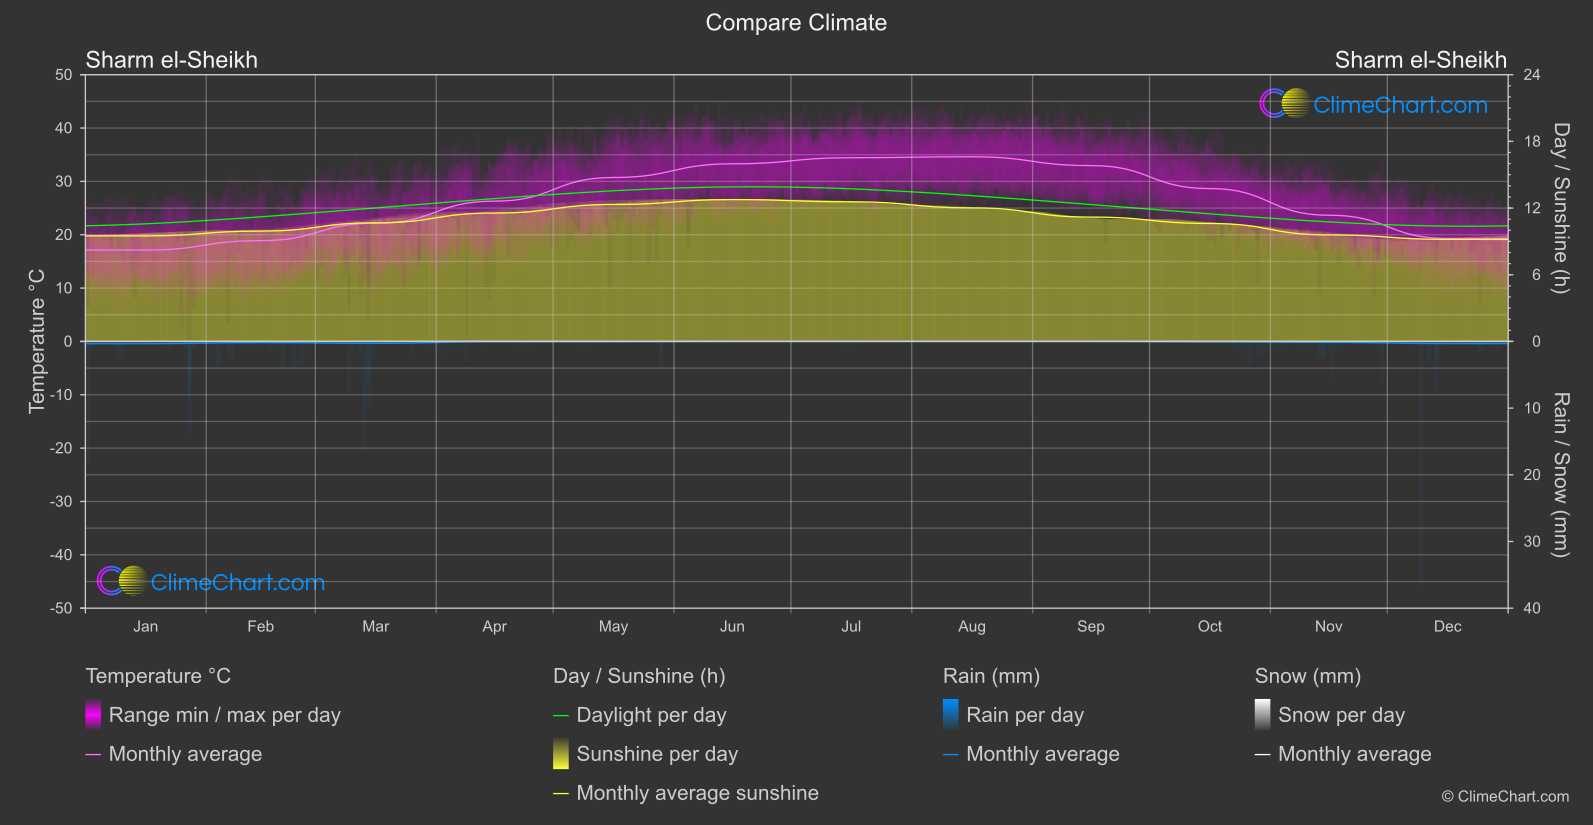
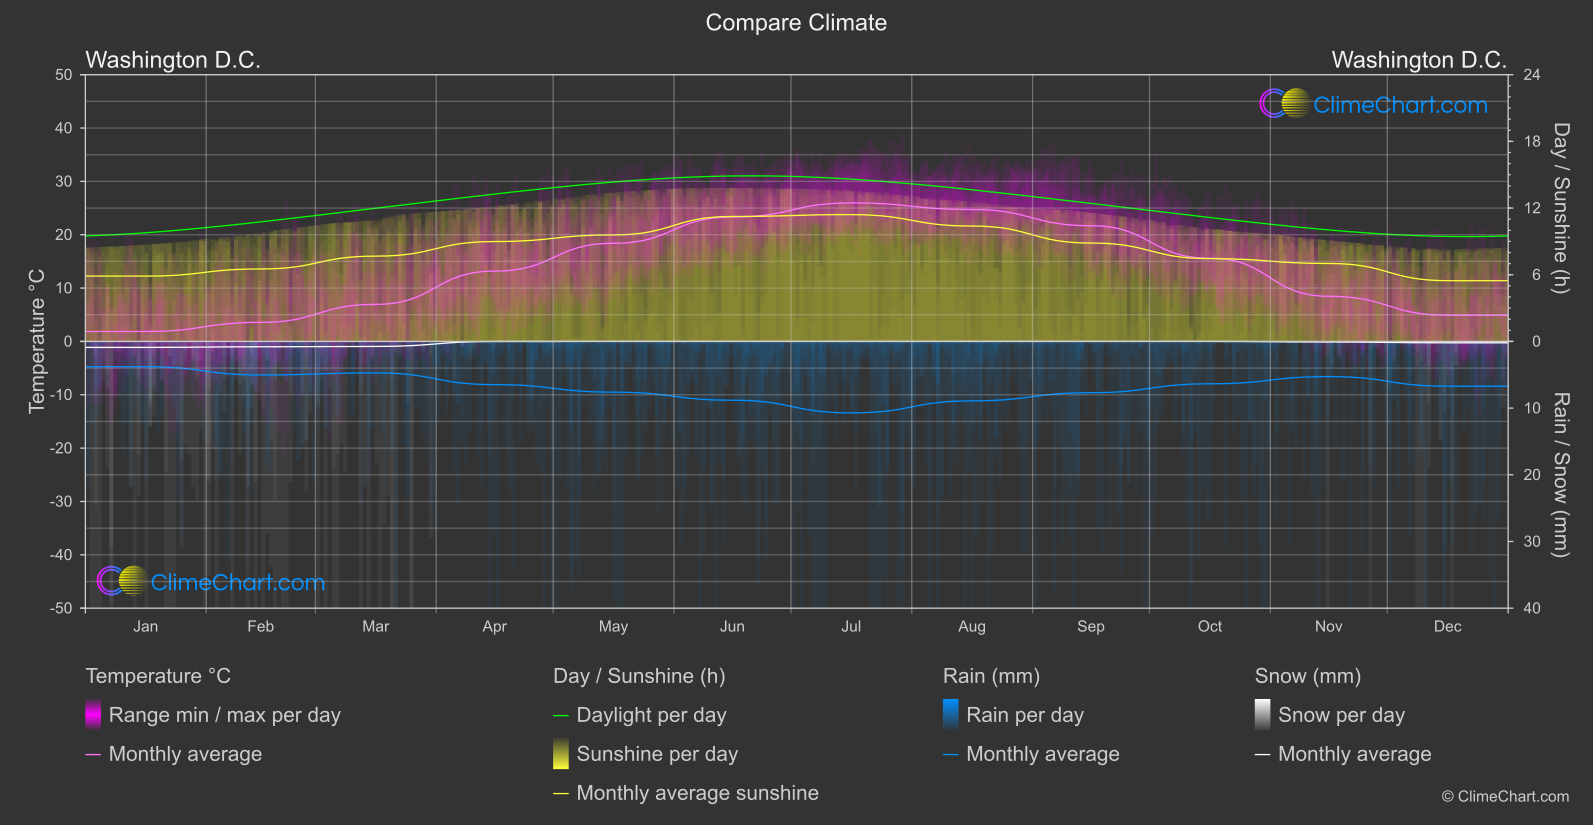
Welcome to our Climate Comparison Tool, where you can explore and compare the weather patterns of Washington D.C., USA and Sharm el-Sheikh, Egypt. Our comprehensive charts provide detailed insights into temperature variations, precipitation levels, and seasonal changes throughout the year. Whether you're planning a trip or just curious about the climate, our tool helps you understand the unique weather conditions of these locations. Discover the best time to visit Washington D.C. and Sharm el-Sheikh and make informed travel decisions based on accurate climate data.
Share this climate chart on
Share
Climate Comparison Data Overview for Washington D.C., USA vs Sharm el-Sheikh, Egypt
Explore the comprehensive climate comparison data for Washington D.C., USA and Sharm el-Sheikh, Egypt. This detailed table provides valuable insights into temperature variations, precipitation levels, and seasonal changes influenced by climate factors, helping you understand the unique weather patterns of these regions.
Temperature °C
| Month |
Washington D.C. |
Sharm el-Sheikh |
+/- |
| Jan |
1.86 |
17.13 |
15.27 |
| Feb |
3.57 |
18.89 |
15.32 |
| Mar |
6.95 |
22.15 |
15.20 |
| Apr |
13.18 |
26.30 |
13.11 |
| May |
18.40 |
30.73 |
12.33 |
| Jun |
23.32 |
33.29 |
9.97 |
| Jul |
25.96 |
34.44 |
8.48 |
| Aug |
24.72 |
34.61 |
9.89 |
| Sep |
21.69 |
32.96 |
11.28 |
| Oct |
15.60 |
28.65 |
13.05 |
| Nov |
8.46 |
23.66 |
15.20 |
| Dec |
4.91 |
19.30 |
14.39 |
| ⌀ Month |
14.05 |
26.84 |
12.79 |
Sunshine (h)
| Month |
Washington D.C. |
Sharm el-Sheikh |
+/- |
| Jan |
5.88 |
9.50 |
3.62 |
| Feb |
6.52 |
9.93 |
3.41 |
| Mar |
7.67 |
10.67 |
3.00 |
| Apr |
8.99 |
11.55 |
2.56 |
| May |
9.58 |
12.32 |
2.73 |
| Jun |
11.24 |
12.76 |
1.52 |
| Jul |
11.41 |
12.56 |
1.15 |
| Aug |
10.38 |
12.02 |
1.64 |
| Sep |
8.85 |
11.19 |
2.33 |
| Oct |
7.45 |
10.61 |
3.16 |
| Nov |
7.01 |
9.58 |
2.57 |
| Dec |
5.47 |
9.18 |
3.71 |
| ⌀ Month |
8.37 |
10.99 |
2.62 |
Rain (mm)
| Month |
Washington D.C. |
Sharm el-Sheikh |
+/- |
| Jan |
1.90 |
0.17 |
-1.73 |
| Feb |
2.51 |
0.09 |
-2.42 |
| Mar |
2.36 |
0.15 |
-2.21 |
| Apr |
3.24 |
0.02 |
-3.22 |
| May |
3.80 |
0.02 |
-3.78 |
| Jun |
4.41 |
0.00 |
-4.41 |
| Jul |
5.36 |
0.00 |
-5.36 |
| Aug |
4.45 |
0.00 |
-4.45 |
| Sep |
3.84 |
0.00 |
-3.84 |
| Oct |
3.18 |
0.03 |
-3.14 |
| Nov |
2.64 |
0.07 |
-2.56 |
| Dec |
3.36 |
0.16 |
-3.19 |
| ⌀ Month |
3.42 |
0.06 |
-3.36 |
Snow (mm)
| Month |
Washington D.C. |
Sharm el-Sheikh |
+/- |
| Jan |
0.45 |
0.00 |
-0.45 |
| Feb |
0.40 |
0.00 |
-0.40 |
| Mar |
0.38 |
0.00 |
-0.38 |
| Apr |
0.00 |
0.00 |
-0.00 |
| May |
0.00 |
0.00 |
0.00 |
| Jun |
0.00 |
0.00 |
0.00 |
| Jul |
0.00 |
0.00 |
0.00 |
| Aug |
0.00 |
0.00 |
0.00 |
| Sep |
0.00 |
0.00 |
0.00 |
| Oct |
0.00 |
0.00 |
0.00 |
| Nov |
0.04 |
0.00 |
-0.04 |
| Dec |
0.10 |
0.00 |
-0.10 |
| ⌀ Month |
0.11 |
0.00 |
-0.11 |