Warmest month
- Halifax
- August · 19.58 °C
- Kuwait City
- July · 38.53 °C
Reference period: Halifax 2013–2023 · Kuwait City 2013–2023
Kuwait City (Kuwait) has a higher monthly mean temperature than Halifax (Canada) in every month of the year.
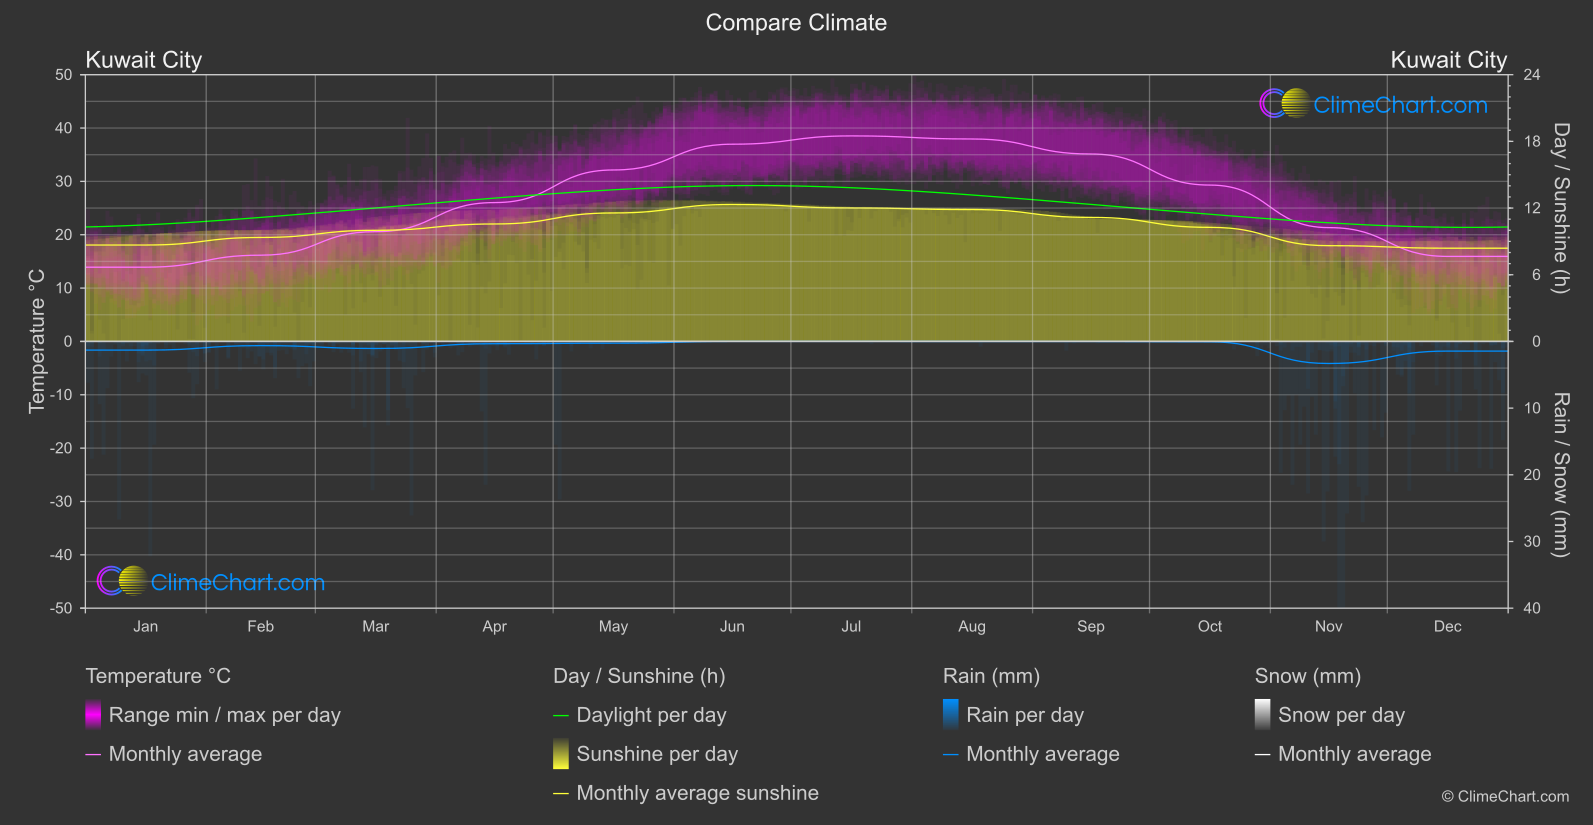

The smallest difference in monthly mean temperature is 15.35 °C (December); the largest is 22.57 °C (May).
The difference between the warmest and coolest monthly means is 22.54 °C in Halifax (Canada) and 24.61 °C in Kuwait City (Kuwait). This describes seasonal variation, not the range between daytime highs and nighttime lows.
Halifax (Canada) has a higher daily rainfall average in 12 months and Kuwait City (Kuwait) in 0; 0 months are equal at the displayed precision. Rainfall amounts do not tell us how many days it rains.
Halifax (Canada) has more average sunshine hours per day in 0 months and Kuwait City (Kuwait) in 12; 0 months are equal at the displayed precision. Sunshine duration is different from daylight duration.
Daily values are averaged separately for each calendar month over the saved reference period. Temperatures are daily means, not daytime highs. Rainfall is an average daily amount, not a monthly total; sunshine is average hours per day. These historical averages are not a weather forecast. Each location’s reference period is listed below and may differ.
Mean of the 12 monthly averages
Difference: Kuwait City (Kuwait) minus Halifax (Canada)
| Month | Halifax | Kuwait City | +/- |
|---|---|---|---|
| Jan | −2.50 | 13.92 | +16.42 |
| Feb | −2.96 | 16.17 | +19.13 |
| Mar | −0.53 | 20.57 | +21.10 |
| Apr | 4.61 | 26.03 | +21.42 |
| May | 9.57 | 32.14 | +22.57 |
| Jun | 14.67 | 36.97 | +22.30 |
| Jul | 19.21 | 38.53 | +19.32 |
| Aug | 19.58 | 37.95 | +18.37 |
| Sep | 16.57 | 35.13 | +18.56 |
| Oct | 11.56 | 29.31 | +17.75 |
| Nov | 5.40 | 21.33 | +15.93 |
| Dec | 0.59 | 15.94 | +15.35 |
| Annual mean | 7.98 | 27.00 | +19.02 |
| Month | Halifax | Kuwait City | +/- |
|---|---|---|---|
| Jan | 4.62 | 8.67 | +4.05 |
| Feb | 5.93 | 9.36 | +3.43 |
| Mar | 7.19 | 10.00 | +2.80 |
| Apr | 7.73 | 10.57 | +2.84 |
| May | 8.78 | 11.56 | +2.78 |
| Jun | 9.06 | 12.32 | +3.27 |
| Jul | 9.52 | 12.01 | +2.49 |
| Aug | 9.73 | 11.86 | +2.13 |
| Sep | 8.19 | 11.16 | +2.97 |
| Oct | 6.56 | 10.26 | +3.71 |
| Nov | 4.73 | 8.62 | +3.88 |
| Dec | 4.03 | 8.39 | +4.36 |
| Annual mean | 7.17 | 10.40 | +3.23 |
| Month | Halifax | Kuwait City | +/- |
|---|---|---|---|
| Jan | 2.90 | 0.65 | −2.25 |
| Feb | 2.82 | 0.31 | −2.50 |
| Mar | 2.16 | 0.53 | −1.63 |
| Apr | 3.62 | 0.17 | −3.45 |
| May | 2.60 | 0.13 | −2.47 |
| Jun | 4.83 | 0.00 | −4.83 |
| Jul | 3.36 | 0.00 | −3.36 |
| Aug | 3.14 | 0.00 | −3.14 |
| Sep | 3.47 | 0.01 | −3.47 |
| Oct | 4.62 | 0.03 | −4.59 |
| Nov | 4.46 | 1.65 | −2.80 |
| Dec | 4.47 | 0.72 | −3.74 |
| Annual mean | 3.54 | 0.35 | −3.19 |
| Month | Halifax | Kuwait City | +/- |
|---|---|---|---|
| Jan | 11.84 | 0.00 | −11.84 |
| Feb | 13.56 | 0.00 | −13.56 |
| Mar | 12.75 | 0.00 | −12.75 |
| Apr | 4.44 | 0.00 | −4.44 |
| May | 0.06 | 0.00 | −0.06 |
| Jun | 0.00 | 0.00 | 0.00 |
| Jul | 0.00 | 0.00 | 0.00 |
| Aug | 0.00 | 0.00 | 0.00 |
| Sep | 0.00 | 0.00 | 0.00 |
| Oct | 0.03 | 0.00 | −0.03 |
| Nov | 2.37 | 0.00 | −2.37 |
| Dec | 7.05 | 0.00 | −7.05 |
| Annual mean | 4.34 | 0.00 | −4.34 |