Climate Chart of Tanna, Vanuatu
Monthly data: Temperature °C, Rain (mm), Sunshine (h) · 2013–2023
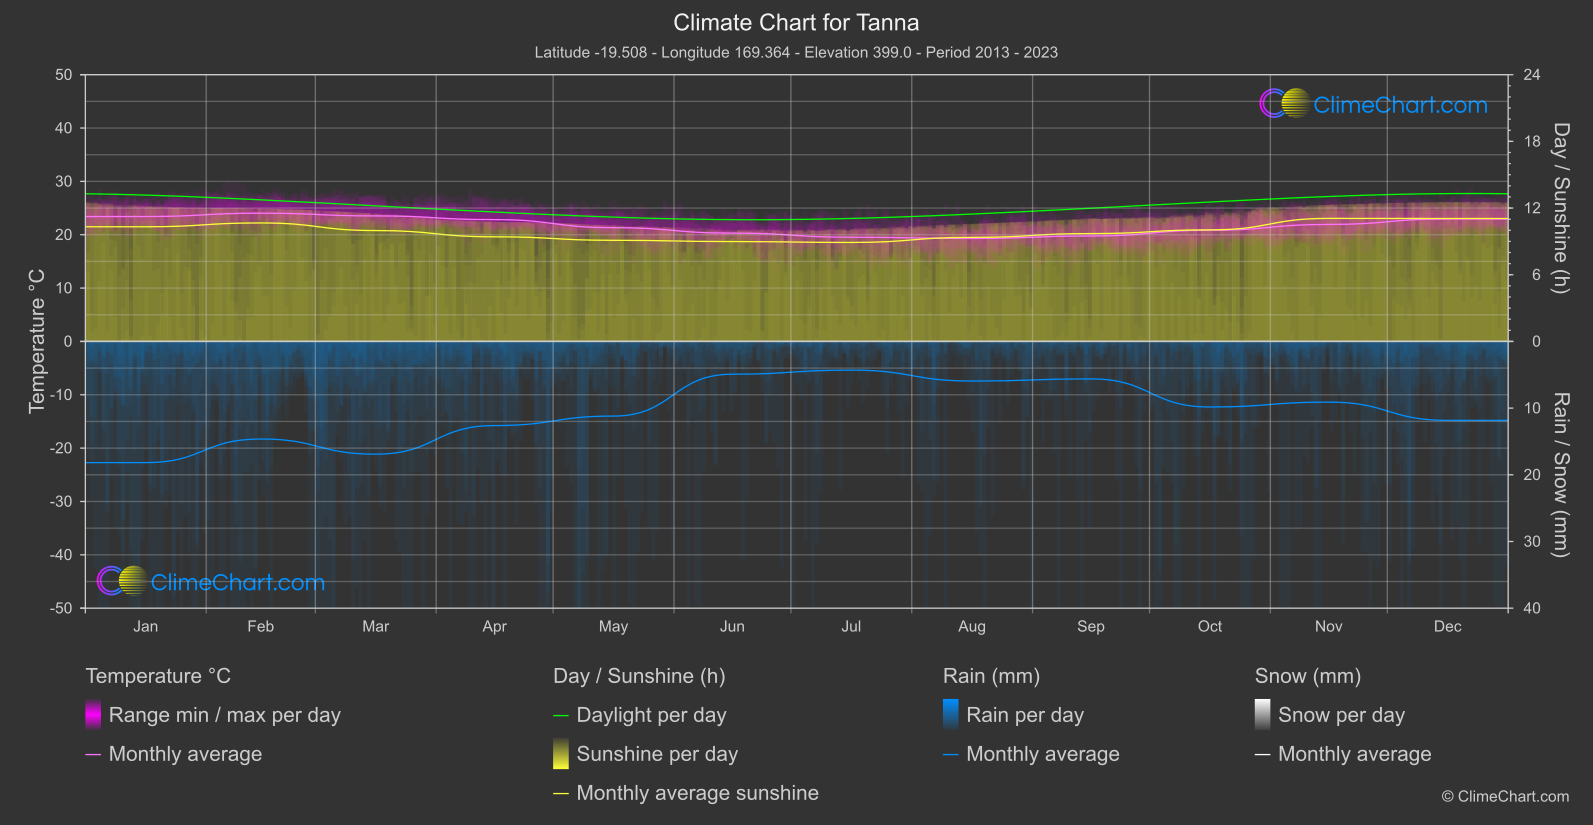
For Tanna, Vanuatu, the climate data cover 2013–2023. Across that period, monthly mean temperatures range from August at 19.3 °C to February at 24.0 °C. The monthly pattern provides a useful guide to broad conditions, while these averages do not describe every day's weather. Rainfall and sunshine also vary by month, so visitors planning outdoor activities may want to consider those patterns alongside their preferred temperatures.
Climate overview
Temperature
The coolest monthly mean temperature occurs in August, at 19.3 °C; the warmest occurs in February, at 24.0 °C. These are monthly averages, not daytime highs or guarantees about conditions on a particular day, so they are best read as a broad guide to the year's temperature pattern. The unweighted mean across the calendar months is 21.6 °C. It summarizes the monthly means rather than a day-weighted annual average, and cannot by itself show how temperatures vary from day to day.
Rain
Mean daily rainfall is highest in January, at 9.09 mm/day, and lowest in July, at 2.15 mm/day. The figures are daily averages for each month, not monthly rainfall totals; the lower average does not guarantee rain-free days or indicate how often rain falls. The unweighted mean of the calendar-month daily rainfall means is 5.21 mm/day. Use it as a broad summary rather than a forecast for a specific date, and consider rain preparation throughout the year.
Sunshine
Mean daily sunshine reaches its highest monthly average in November, at 11.07 hours/day, and its lowest in July, at 8.90 hours/day. These are averages of sunshine duration, not measures of day length, and actual daily conditions can differ. The unweighted mean across the calendar-month sunshine averages is 9.88 hours/day per day. This gives a general sense of the year, but not the sunshine visitors will necessarily experience on any individual day.
Best Travel Time Guide for Tanna, Vanuatu: Ideal Seasons and Weather Insights
For visitors prioritising cooler monthly averages, August is the clearest temperature-based option, when the monthly mean is 19.3 °C. This does not predict daytime highs or day-to-day weather, so plan flexibly rather than treating the average as a guarantee. If lower average rainfall is your priority, July is the conditional option, with mean daily rainfall of 2.15 mm/day; it does not promise dry days or tell you how frequently rain occurs. In January, the mean daily rainfall is 9.09 mm/day, making rain-ready plans especially worth considering against that monthly average.
For outdoor sightseeing planned around average sunshine duration, November has the highest monthly mean at 11.07 hours/day, while July has the lowest at 8.90 hours/day. Sunshine hours are not day length and cannot guarantee clear conditions, so use these figures as one planning consideration rather than a combined best-time ranking.
Climate Data Overview for Tanna, Vanuatu
Explore the comprehensive climate data for Tanna, Vanuatu. This detailed table provides valuable insights into temperature variations, precipitation levels, and seasonal changes, helping you understand the unique weather patterns of this region.
| Month | Average: Temperature °C | Rain (mm) / day | Snow (mm) / day | Sunshine (h) / day |
|---|---|---|---|---|
| Jan | 23.4 | 9.09 | 0.00 | 10.32 |
| Feb | 24.0 | 7.32 | 0.00 | 10.66 |
| Mar | 23.5 | 8.45 | 0.00 | 9.98 |
| Apr | 22.8 | 6.31 | 0.00 | 9.41 |
| May | 21.3 | 5.60 | 0.00 | 9.10 |
| Jun | 20.3 | 2.46 | 0.00 | 8.99 |
| Jul | 19.5 | 2.15 | 0.00 | 8.90 |
| Aug | 19.3 | 2.97 | 0.00 | 9.36 |
| Sep | 19.8 | 2.81 | 0.00 | 9.70 |
| Oct | 20.8 | 4.92 | 0.00 | 10.04 |
| Nov | 21.9 | 4.55 | 0.00 | 11.07 |
| Dec | 23.0 | 5.92 | 0.00 | 11.06 |
| Average | 21.6 | 5.21 | 0.00 | 9.88 |