Climate Chart of Tahiti, French Polynesia
Monthly data: Temperature °C, Rain (mm), Sunshine (h) · 2013–2023
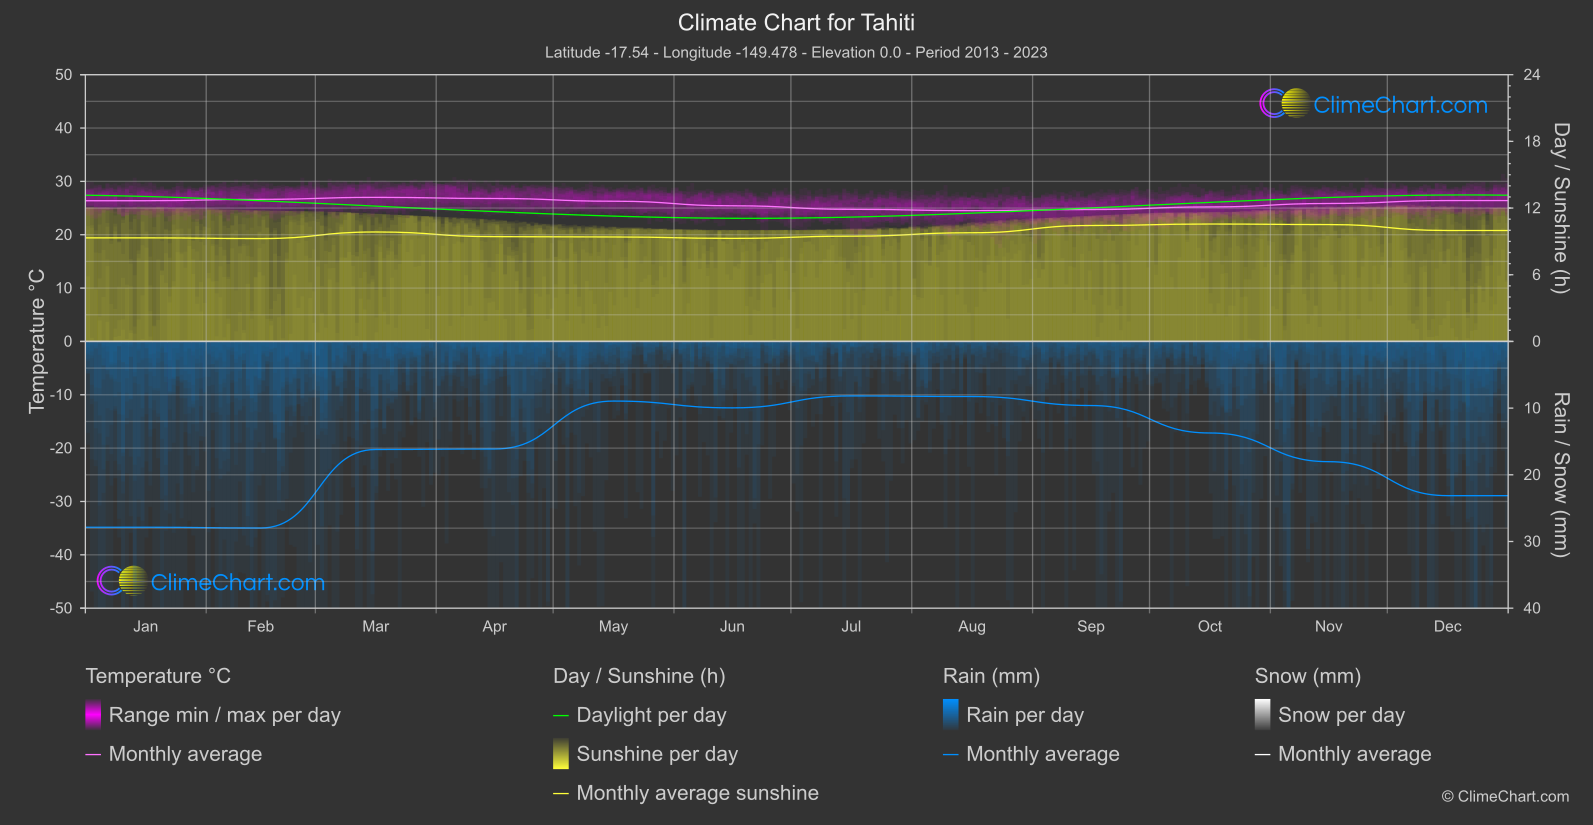
For Tahiti, French Polynesia, the climate data describe 2013–2023. Monthly mean temperatures remain within a relatively narrow range: the warmest monthly mean is March at 27.0 °C, while the coolest is August at 24.5 °C. Mean daily rainfall and sunshine also vary across the year, so visitors can use the monthly patterns to guide planning while remembering that averages do not describe conditions on any particular day.
Climate overview
Temperature
The warmest monthly mean temperature is recorded in March, at 27.0 °C; the coolest is in August, at 24.5 °C. These are monthly averages, not daytime highs, and they frame a fairly restrained annual temperature range. The unweighted mean across monthly means is 25.8 °C. Such summaries describe broad monthly conditions, not the temperature visitors will experience at a particular hour or on a particular day.
Rain
Mean daily rainfall is highest in February, at 13.99 mm/day, and lowest in July, at 4.09 mm/day. These figures are daily means for their respective months rather than monthly totals, and the lower average does not guarantee rain-free days or indicate how often rain occurs. Across the calendar-month means, the unweighted mean is 7.83 mm/day; use the monthly pattern as a planning guide, not a forecast.
Sunshine
Average daily sunshine reaches its highest monthly mean in October, at 10.56 hours/day, and its lowest in February, at 9.25 hours/day. The unweighted mean across monthly means is 9.77 hours/day. These values describe average sunshine duration, not daylight length or guaranteed sun on an individual day, so they can help with broad outdoor planning but cannot promise clear conditions.
Best Travel Time Guide for Tahiti, French Polynesia: Ideal Seasons and Weather Insights
For visitors prioritising lower average rainfall, July is the conditional option to consider, with mean daily rainfall of 4.09 mm/day. It is still sensible to prepare for showers: the highest monthly mean is 13.99 mm/day in February, and neither average tells you whether rain will fall on a particular day or how frequently. If cooler monthly averages are your priority, consider August, when the monthly mean temperature is 24.5 °C; this is not a daytime maximum and does not predict day-to-day conditions. For outdoor sightseeing planned around average sunshine, October has the highest mean daily sunshine duration at 10.56 hours/day, while February has the lowest at 9.25 hours/day. Sunshine duration is not day length, and these criteria point to separate planning choices rather than one universally best time to visit.
Climate Data Overview for Tahiti, French Polynesia
Explore the comprehensive climate data for Tahiti, French Polynesia. This detailed table provides valuable insights into temperature variations, precipitation levels, and seasonal changes, helping you understand the unique weather patterns of this region.
| Month | Average: Temperature °C | Rain (mm) / day | Snow (mm) / day | Sunshine (h) / day |
|---|---|---|---|---|
| Jan | 26.4 | 13.93 | 0.00 | 9.32 |
| Feb | 26.6 | 13.99 | 0.00 | 9.25 |
| Mar | 27.0 | 8.10 | 0.00 | 9.85 |
| Apr | 26.8 | 8.06 | 0.00 | 9.43 |
| May | 26.3 | 4.47 | 0.00 | 9.40 |
| Jun | 25.4 | 4.98 | 0.00 | 9.27 |
| Jul | 24.8 | 4.09 | 0.00 | 9.47 |
| Aug | 24.5 | 4.13 | 0.00 | 9.78 |
| Sep | 24.7 | 4.81 | 0.00 | 10.43 |
| Oct | 25.2 | 6.86 | 0.00 | 10.56 |
| Nov | 25.9 | 9.02 | 0.00 | 10.52 |
| Dec | 26.4 | 11.56 | 0.00 | 9.98 |
| Average | 25.8 | 7.83 | 0.00 | 9.77 |