Climate Chart of Saint Lucia, Saint Lucia
Comprehensive Climate Chart of Saint Lucia, Saint Lucia: Monthly Averages and Weather Trends
Welcome to Saint Lucia! Known for its lush landscapes, stunning beaches, and vibrant culture, this Caribbean island is a popular destination for travelers seeking both relaxation and adventure.
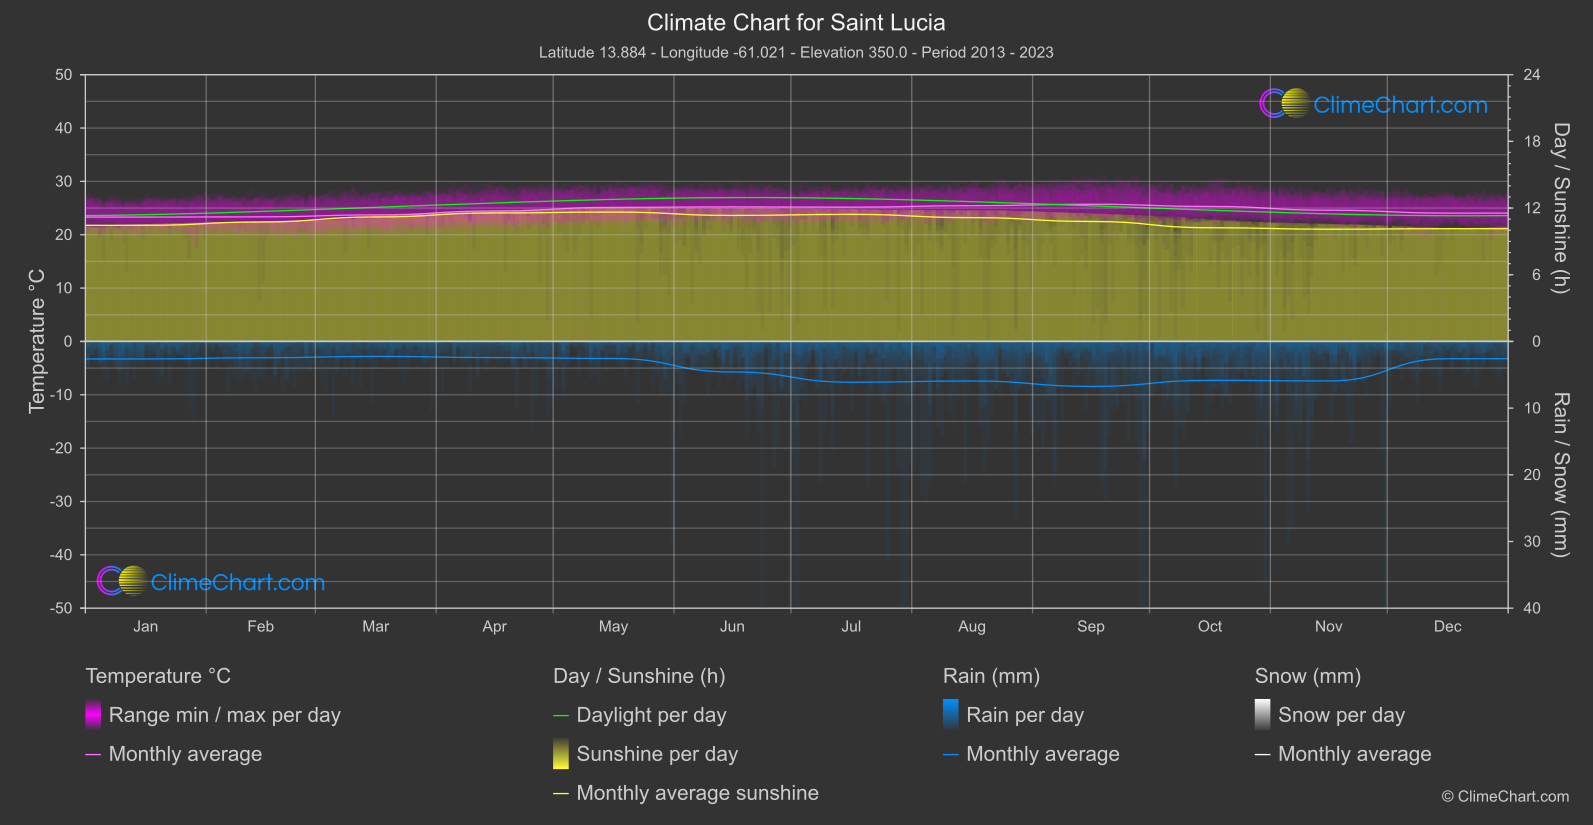
Saint Lucia enjoys a tropical maritime climate with warm temperatures year-round. The wet season typically runs from June to November, with the heaviest rainfall occurring between August and October. The dry season from December to May brings sunny skies and lower humidity levels, making it an ideal time to visit for those seeking beach days and outdoor activities.
Best Travel Time Guide for Saint Lucia, Saint Lucia: Ideal Seasons and Weather Insights
The best time to travel to Saint Lucia is during the dry season from December to May when the weather is sunny and pleasant for outdoor activities. This period is ideal for beach vacations, snorkeling, and exploring the island's lush landscapes. Avoid the wet season from June to November if you prefer to avoid heavy rainfall and humidity.
Climate Data Overview for Saint Lucia, Saint Lucia
Explore the comprehensive climate data for Saint Lucia, Saint Lucia. This detailed table provides valuable insights into temperature variations, precipitation levels, and seasonal changes, helping you understand the unique weather patterns of this region.
| Month | ⌀ Temperature °C | ⌀ Rain (mm) | ⌀ Snow (mm) | ⌀ Sunshine (h) |
|---|---|---|---|---|
| Jan | 23.3 | 1.31 | 0.00 | 10.44 |
| Feb | 23.4 | 1.22 | 0.00 | 10.74 |
| Mar | 23.7 | 1.12 | 0.00 | 11.20 |
| Apr | 24.5 | 1.21 | 0.00 | 11.56 |
| May | 25.1 | 1.28 | 0.00 | 11.64 |
| Jun | 25.2 | 2.29 | 0.00 | 11.34 |
| Jul | 25.2 | 3.06 | 0.00 | 11.43 |
| Aug | 25.4 | 2.96 | 0.00 | 11.14 |
| Sep | 25.7 | 3.37 | 0.00 | 10.79 |
| Oct | 25.3 | 2.92 | 0.00 | 10.23 |
| Nov | 24.6 | 2.96 | 0.00 | 10.10 |
| Dec | 24.1 | 1.30 | 0.00 | 10.14 |
| ⌀ Month | 24.6 | 2.08 | 0.00 | 10.90 |