Climate Chart of Monteverde, Costa Rica
Monthly data: Temperature °C, Rain (mm), Sunshine (h) · 2013–2023
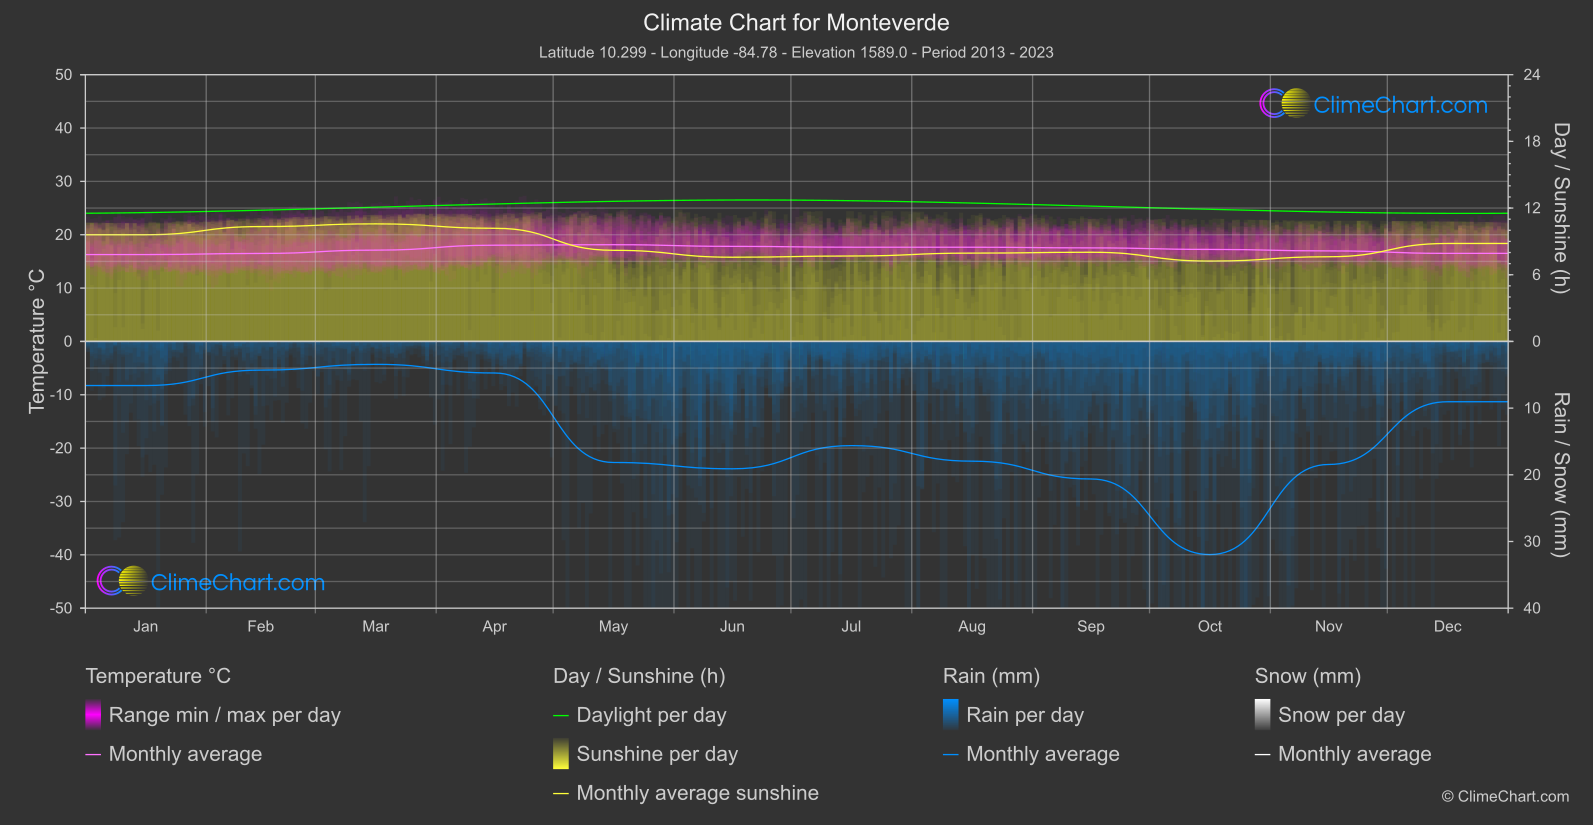
For Monteverde, Costa Rica, the climate data describe 2013–2023. Monthly mean temperatures stay within a fairly close range, with the overall mean at 17.3 °C. Daily rainfall means show a clearer spread across the calendar, while sunshine averages provide another useful guide to how conditions vary month by month. These are monthly averages rather than forecasts for particular dates, so visitors should use them to frame expectations rather than assume conditions will be consistent throughout a stay.
Climate overview
Temperature
The warmest monthly mean temperature occurs in May at 18.1 °C, while the coolest monthly mean is in January at 16.3 °C. The mean across monthly means is 17.3 °C. These figures describe average temperatures for each month, not daytime highs; day-to-day conditions can vary around those monthly values.
Rain
Mean daily rainfall is highest in October at 15.98 mm/day, making that the month to keep in mind when preparing for wetter average conditions. It is lowest in March at 1.72 mm/day, which can be a conditional option for visitors prioritising lower average rainfall. The mean across monthly means is 7.08 mm/day; these daily averages do not show how often rain falls or guarantee dry or wet weather on a particular day.
Sunshine
Average daily sunshine reaches its highest level in March at 10.58 hours/day and its lowest in October at 7.23 hours/day. The mean across monthly means is 8.65 hours/day. These duration averages can help with broad outdoor-planning expectations, but sunshine hours are not the same as day length and do not guarantee uninterrupted sunshine on an individual day.
Best Travel Time Guide for Monteverde, Costa Rica: Ideal Seasons and Weather Insights
For visitors prioritising cooler monthly-average conditions, January is the relevant option: its monthly mean temperature is 16.3 °C. This is not a prediction of daytime highs or the temperature on a specific date, so flexible clothing is more useful than relying on the monthly mean alone. If lower average rainfall is the main criterion, March is the conditional choice, with mean daily rainfall of 1.72 mm/day. For rain preparation, note that the highest monthly mean daily rainfall is in October at 15.98 mm/day; these averages do not quantify rainy-day frequency, so visitors may still want rain protection whatever their travel dates. For planning outdoor sightseeing around average sunshine, March has the highest mean daily sunshine duration at 10.58 hours/day, while October has the lowest at 7.23 hours/day. These are useful broad comparisons, not guarantees of clear skies, and sunshine duration should not be read as day length.
Climate Data Overview for Monteverde, Costa Rica
Explore the comprehensive climate data for Monteverde, Costa Rica. This detailed table provides valuable insights into temperature variations, precipitation levels, and seasonal changes, helping you understand the unique weather patterns of this region.
| Month | Average: Temperature °C | Rain (mm) / day | Snow (mm) / day | Sunshine (h) / day |
|---|---|---|---|---|
| Jan | 16.3 | 3.31 | 0.00 | 9.60 |
| Feb | 16.5 | 2.15 | 0.00 | 10.33 |
| Mar | 17.1 | 1.72 | 0.00 | 10.58 |
| Apr | 18.0 | 2.37 | 0.00 | 10.18 |
| May | 18.1 | 9.08 | 0.00 | 8.20 |
| Jun | 17.8 | 9.55 | 0.00 | 7.58 |
| Jul | 17.7 | 7.81 | 0.00 | 7.69 |
| Aug | 17.7 | 8.98 | 0.00 | 7.95 |
| Sep | 17.5 | 10.31 | 0.00 | 8.02 |
| Oct | 17.2 | 15.98 | 0.00 | 7.23 |
| Nov | 17.0 | 9.22 | 0.00 | 7.62 |
| Dec | 16.5 | 4.52 | 0.00 | 8.81 |
| Average | 17.3 | 7.08 | 0.00 | 8.65 |