Climate Chart of Cayman Islands, Cayman Islands
Comprehensive Climate Chart of Cayman Islands, Cayman Islands: Monthly Averages and Weather Trends
Explore the tropical paradise of Cayman Islands
Cayman Islands, located in the western Caribbean Sea, enjoy a tropical marine climate with warm temperatures throughout the year. The dry season from November to April offers sunny days and lower humidity, while the wet season from May to October sees occasional showers and thunderstorms. The average temperature ranges from 75°F to 85°F, making it an ideal destination for beach lovers and water sports enthusiasts.
Best Travel Time Guide for Cayman Islands, Cayman Islands: Ideal Seasons and Weather Insights
The best time to travel to Cayman Islands is during the dry season from November to April when you can enjoy sunny days and pleasant weather. This period is perfect for beach activities, snorkeling, and diving. However, if you prefer fewer crowds and don't mind some rain, the wet season from May to October also offers great deals on accommodations.
Climate Data Overview for Cayman Islands, Cayman Islands
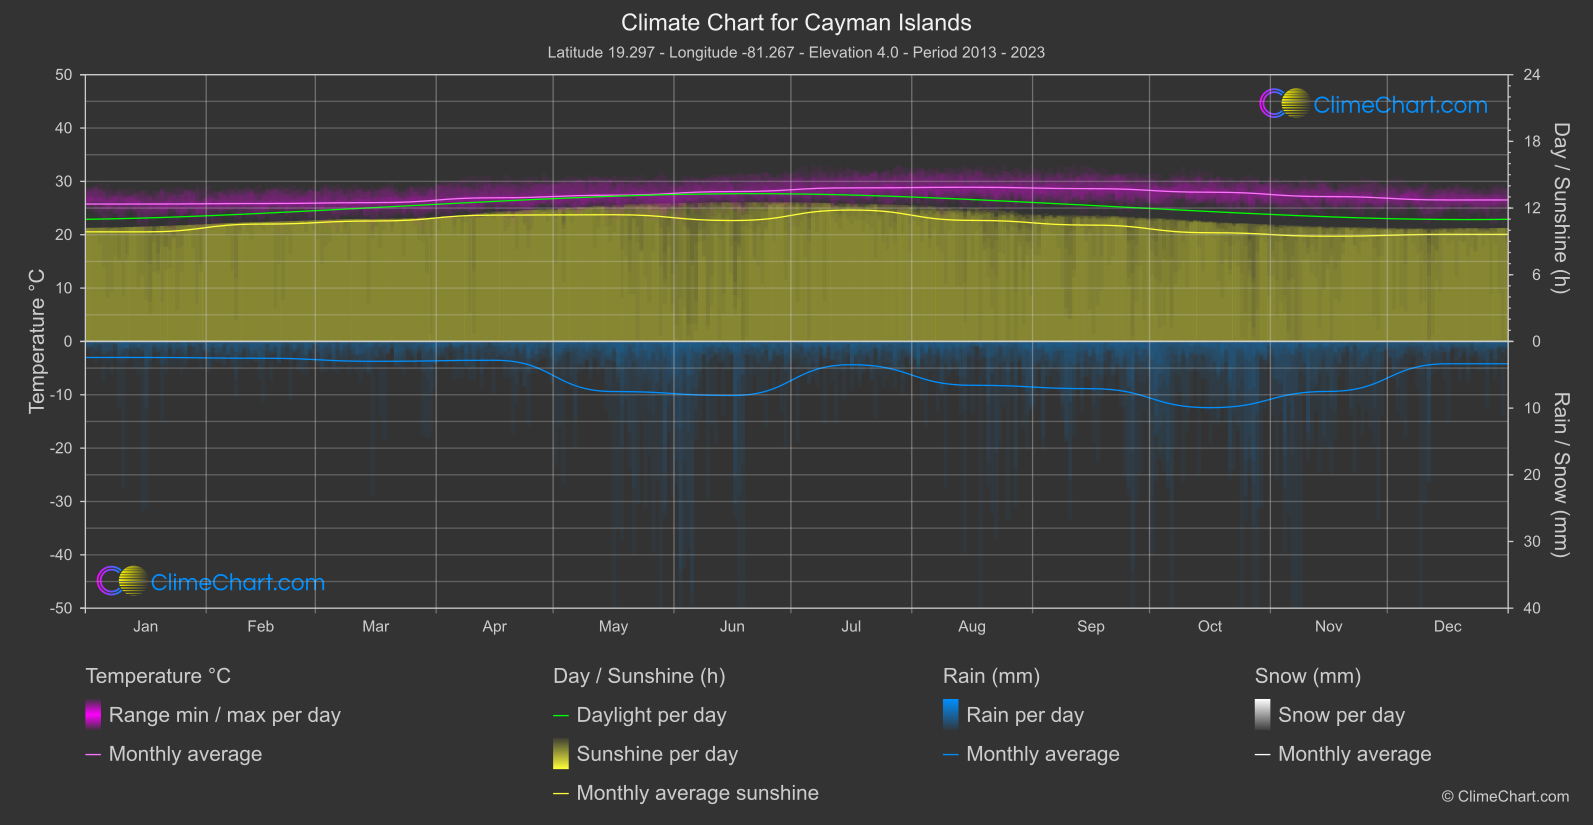
Explore the comprehensive climate data for Cayman Islands, Cayman Islands. This detailed table provides valuable insights into temperature variations, precipitation levels, and seasonal changes, helping you understand the unique weather patterns of this region.
| Month | ⌀ Temperature °C | ⌀ Rain (mm) | ⌀ Snow (mm) | ⌀ Sunshine (h) |
|---|---|---|---|---|
| Jan | 25.8 | 1.20 | 0.00 | 9.86 |
| Feb | 25.8 | 1.26 | 0.00 | 10.56 |
| Mar | 26.0 | 1.49 | 0.00 | 10.84 |
| Apr | 26.9 | 1.41 | 0.00 | 11.37 |
| May | 27.4 | 3.76 | 0.00 | 11.40 |
| Jun | 28.1 | 4.05 | 0.00 | 10.88 |
| Jul | 28.8 | 1.75 | 0.00 | 11.82 |
| Aug | 28.9 | 3.29 | 0.00 | 10.89 |
| Sep | 28.6 | 3.54 | 0.00 | 10.47 |
| Oct | 28.0 | 4.97 | 0.00 | 9.78 |
| Nov | 27.1 | 3.75 | 0.00 | 9.47 |
| Dec | 26.5 | 1.68 | 0.00 | 9.63 |
| ⌀ Month | 27.3 | 2.68 | 0.00 | 10.58 |