Climate Chart of Bissau, Guinea-Bissau
Comprehensive Climate Chart of Bissau, Guinea-Bissau: Monthly Averages and Weather Trends
Explore the Climate of Bissau, Guinea-Bissau
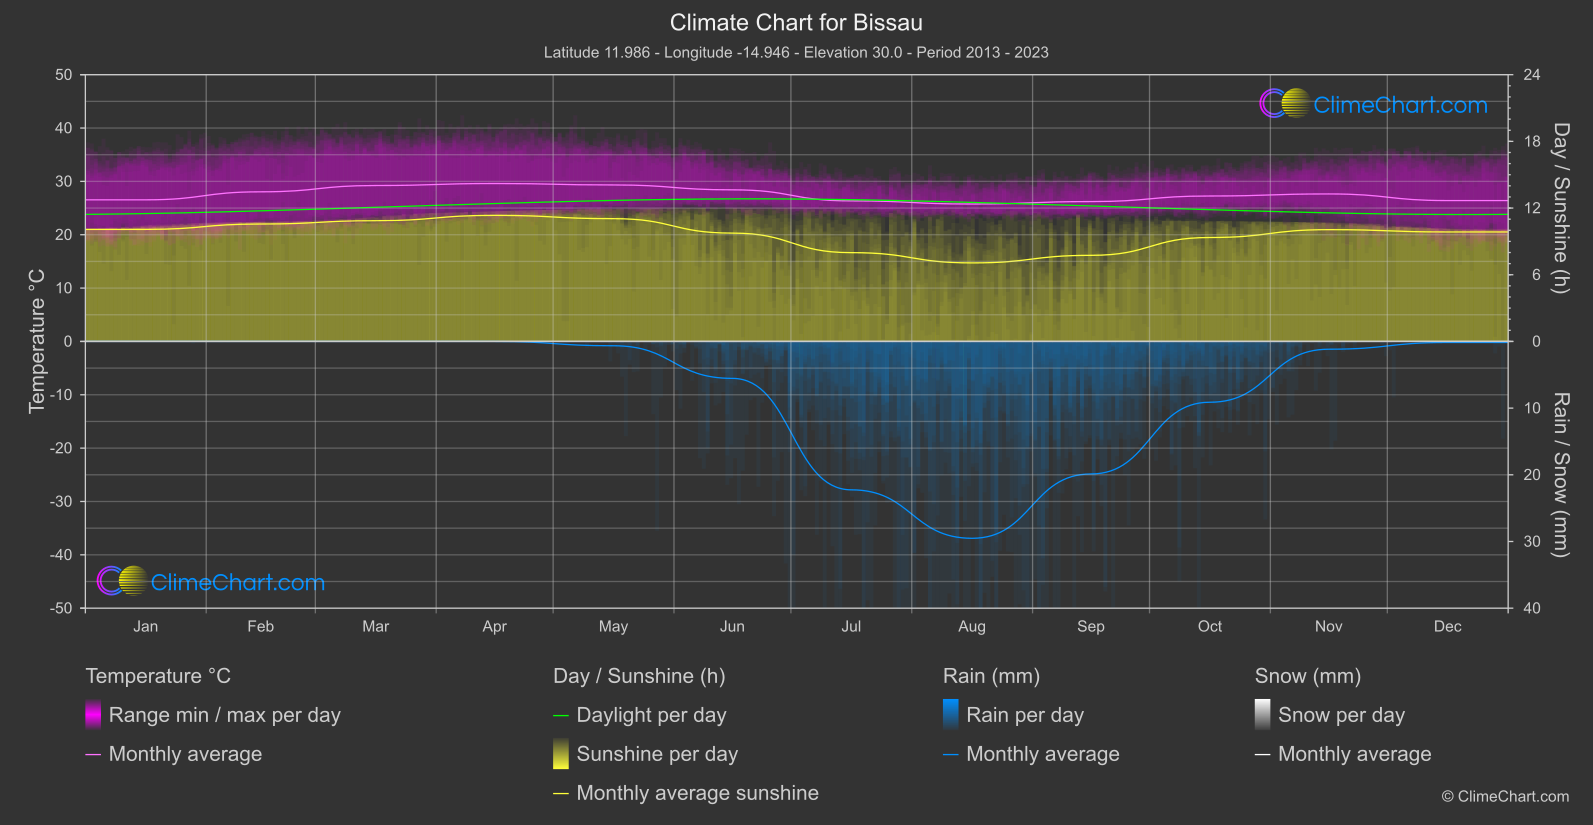
Bissau, the capital city of Guinea-Bissau, experiences a tropical monsoon climate with distinct wet and dry seasons. The rainy season typically lasts from June to October, with heavy rainfall and high humidity. The dry season occurs from November to May, characterized by cooler temperatures and less precipitation. The average annual temperature in Bissau is around 27°C (81°F), making it a warm and humid destination throughout the year.
Best Travel Time Guide for Bissau, Guinea-Bissau: Ideal Seasons and Weather Insights
The best time to travel to Bissau is during the dry season from November to May when the weather is more pleasant with lower humidity and less rainfall. This period offers ideal conditions for exploring the city and enjoying outdoor activities. However, travelers should be prepared for higher temperatures during the hot season from March to June. Overall, Bissau can be visited year-round, but the dry season is generally preferred for a more comfortable experience.
Climate Data Overview for Bissau, Guinea-Bissau
Explore the comprehensive climate data for Bissau, Guinea-Bissau. This detailed table provides valuable insights into temperature variations, precipitation levels, and seasonal changes, helping you understand the unique weather patterns of this region.
| Month | ⌀ Temperature °C | ⌀ Rain (mm) | ⌀ Snow (mm) | ⌀ Sunshine (h) |
|---|---|---|---|---|
| Jan | 26.5 | 0.00 | 0.00 | 10.08 |
| Feb | 28.0 | 0.00 | 0.00 | 10.56 |
| Mar | 29.2 | 0.00 | 0.00 | 10.86 |
| Apr | 29.6 | 0.00 | 0.00 | 11.34 |
| May | 29.3 | 0.32 | 0.00 | 11.05 |
| Jun | 28.4 | 2.77 | 0.00 | 9.75 |
| Jul | 26.3 | 11.13 | 0.00 | 7.99 |
| Aug | 25.8 | 14.76 | 0.00 | 7.06 |
| Sep | 26.2 | 9.94 | 0.00 | 7.75 |
| Oct | 27.3 | 4.56 | 0.00 | 9.35 |
| Nov | 27.6 | 0.58 | 0.00 | 10.06 |
| Dec | 26.4 | 0.08 | 0.00 | 9.85 |
| ⌀ Month | 27.6 | 3.68 | 0.00 | 9.64 |