Climate Chart of Benidorm, Spain
Monthly data: Temperature °C, Rain (mm), Sunshine (h) · 2013–2023
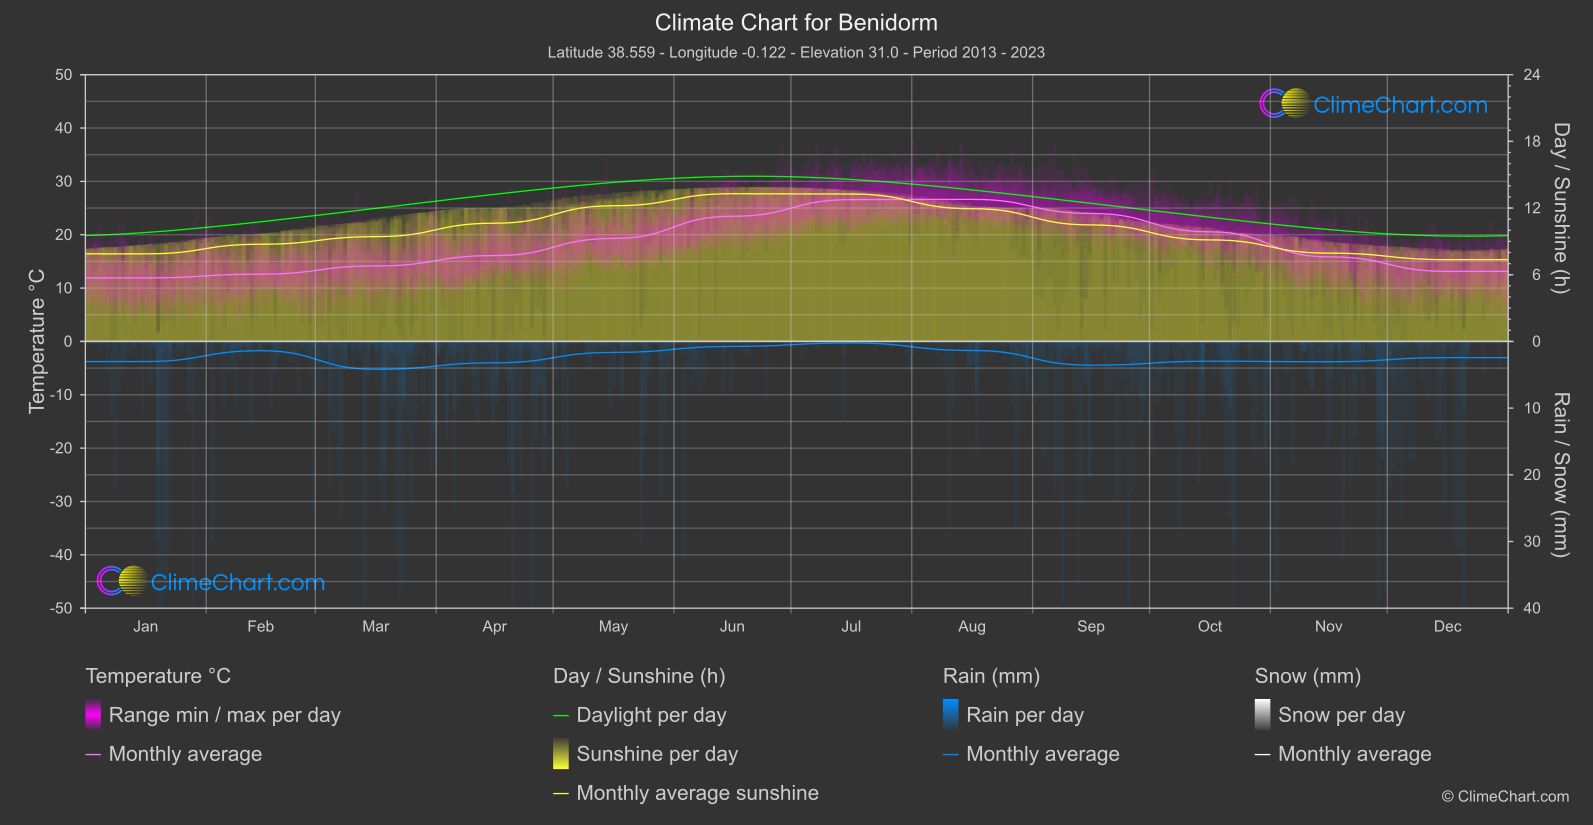
For Benidorm, Spain, the climate data describe 2013–2023. Monthly mean temperatures are highest in July / August at 26.6 °C, while the lowest monthly mean is 11.9 °C in January. The rainfall and sunshine figures add useful context for planning: they describe average daily amounts or duration by month, not a guarantee of what any particular day will bring.
Climate overview
Temperature
The coolest monthly mean is 11.9 °C in January, while July / August has the highest monthly mean, 26.6 °C. These figures describe monthly averages rather than daytime maximum temperatures, so they do not show how warm an individual afternoon may become. Across the calendar months, the unweighted mean of monthly means is 18.7 °C; it is a broad summary, not a day-weighted annual average.
Rain
Mean daily rainfall is highest in March at 2.09 mm/day, and lowest in July at 0.12 mm/day. The unweighted mean across monthly means is 1.16 mm/day. These are average daily amounts, not monthly totals: they indicate relative rainfall amounts by month but do not establish how often rain falls or whether a particular day will be wet.
Sunshine
Mean daily sunshine duration reaches its highest monthly value in June at 13.29 hours/day, and its lowest in December at 7.36 hours/day. The unweighted mean across monthly means is 10.19 hours/day. These averages can help with broad outdoor planning, but sunshine duration is not the same as day length and does not guarantee clear skies on a specific date.
Best Travel Time Guide for Benidorm, Spain: Ideal Seasons and Weather Insights
For visitors prioritising lower average rainfall, July is the conditional option, with mean daily rainfall of 0.12 mm/day. This average does not guarantee dry days or show rain frequency, so flexible plans and suitable rain preparation remain sensible. If you prefer cooler monthly mean temperatures, consider January, when the monthly mean is 11.9 °C; this is not a prediction of daytime highs. For outdoor sightseeing planned around sunshine duration, June has the highest mean daily sunshine at 13.29 hours/day, while December has the lowest at 7.36 hours/day. These are separate planning criteria, not a combined best-time ranking, and sunshine duration is not day length.
Prepare for rainfall with March in mind: it has the highest mean daily rainfall, 2.09 mm/day. The figure is an average daily amount rather than a monthly total, and it cannot tell you how many wet days to expect; check conditions close to travel and pack accordingly.
Climate Data Overview for Benidorm, Spain
Explore the comprehensive climate data for Benidorm, Spain. This detailed table provides valuable insights into temperature variations, precipitation levels, and seasonal changes, helping you understand the unique weather patterns of this region.
| Month | Average: Temperature °C | Rain (mm) / day | Snow (mm) / day | Sunshine (h) / day |
|---|---|---|---|---|
| Jan | 11.9 | 1.51 | 0.00 | 7.88 |
| Feb | 12.6 | 0.69 | 0.00 | 8.75 |
| Mar | 14.1 | 2.09 | 0.00 | 9.43 |
| Apr | 16.1 | 1.60 | 0.00 | 10.64 |
| May | 19.3 | 0.82 | 0.00 | 12.21 |
| Jun | 23.5 | 0.37 | 0.00 | 13.29 |
| Jul | 26.6 | 0.12 | 0.00 | 13.26 |
| Aug | 26.6 | 0.68 | 0.00 | 11.94 |
| Sep | 24.0 | 1.78 | 0.00 | 10.48 |
| Oct | 20.5 | 1.48 | 0.00 | 9.14 |
| Nov | 15.9 | 1.52 | 0.00 | 7.94 |
| Dec | 13.1 | 1.22 | 0.00 | 7.36 |
| Average | 18.7 | 1.16 | 0.00 | 10.19 |