Climate Change Chart of Timbuktu (Sahara), Mali
Comprehensive Climate Change Chart of Timbuktu (Sahara), Mali: Monthly Averages and Impact Trends
Explore the changing climate in Timbuktu (Sahara), Mali with insights from temperature, rainfall, and sunshine duration data. Learn about the significant changes over the years.
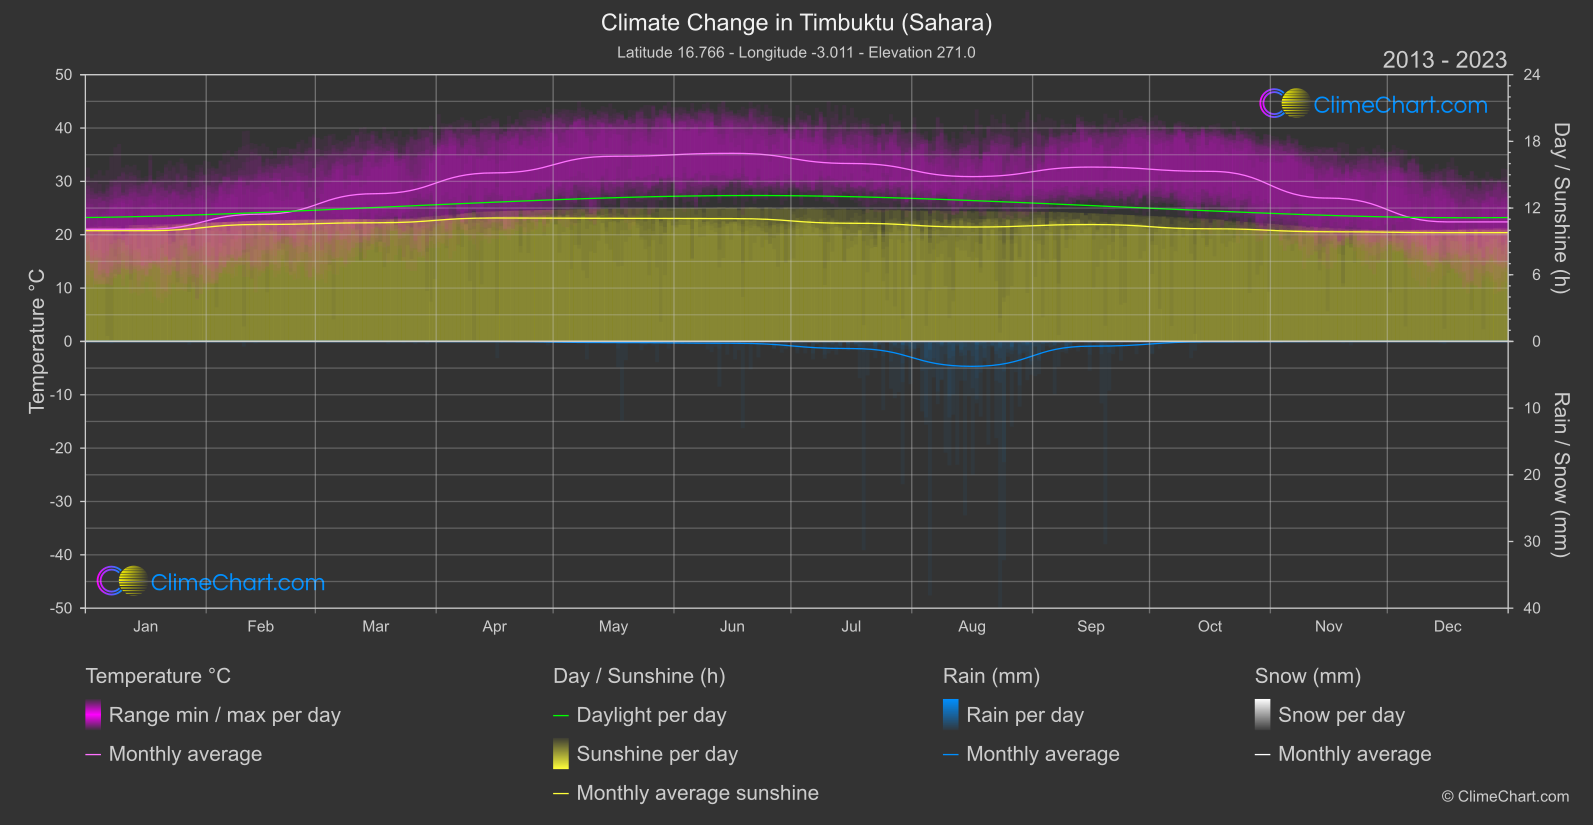
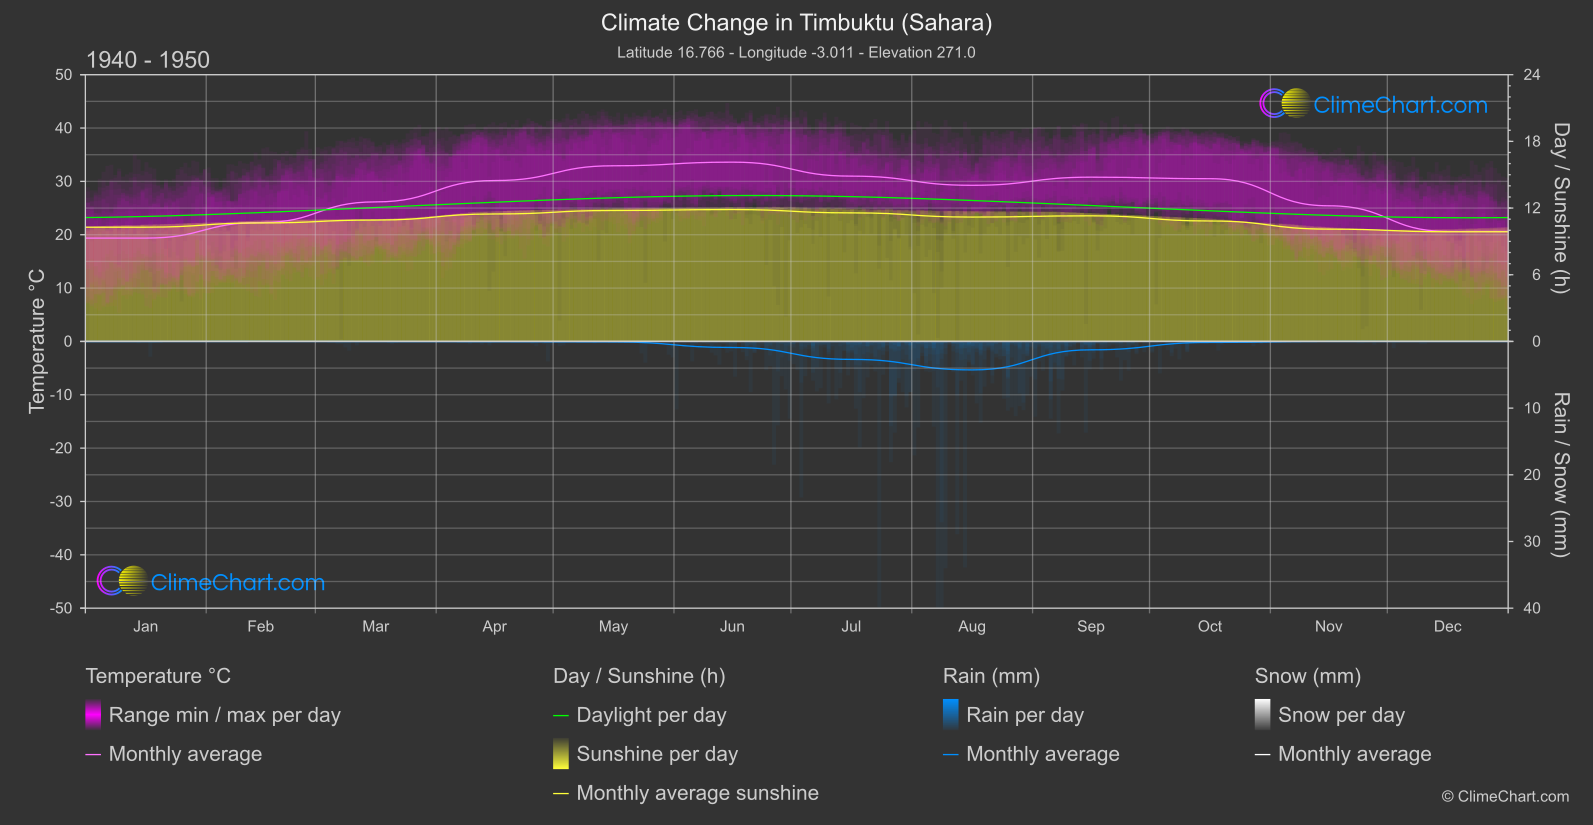
Timbuktu in the Sahara desert of Mali has experienced notable changes in climate over the years. Analyzing temperature data reveals that July has seen the highest increase in temperature, while November has also shown a significant rise. In terms of rainfall, June has experienced the most drastic decrease, with July following closely. Sunshine duration has decreased notably in June and July as well.
Climate Change Data Overview for Timbuktu (Sahara), Mali
Explore the comprehensive climate change data for Timbuktu (Sahara), Mali. This detailed table provides valuable insights into temperature variations, precipitation levels, and seasonal changes influenced by climate change, helping you understand the unique weather patterns of this region.
Temperature °C
| Month | ⌀ 1940 - 1950 | ⌀ 2013 - 2023 | +/- |
|---|---|---|---|
| Jan | 19.37 | 21.02 | 1.65 |
| Feb | 22.28 | 23.86 | 1.58 |
| Mar | 26.16 | 27.69 | 1.54 |
| Apr | 30.16 | 31.59 | 1.44 |
| May | 32.93 | 34.71 | 1.78 |
| Jun | 33.61 | 35.26 | 1.65 |
| Jul | 30.98 | 33.35 | 2.37 |
| Aug | 29.26 | 30.90 | 1.63 |
| Sep | 30.79 | 32.68 | 1.89 |
| Oct | 30.50 | 31.88 | 1.38 |
| Nov | 25.42 | 26.87 | 1.44 |
| Dec | 20.62 | 22.40 | 1.78 |
| ⌀ Month | 27.67 | 29.35 | 1.68 |
Sunshine (h)
| Month | ⌀ 1940 - 1950 | ⌀ 2013 - 2023 | +/- |
|---|---|---|---|
| Jan | 10.28 | 9.96 | -0.32 |
| Feb | 10.66 | 10.52 | -0.14 |
| Mar | 10.92 | 10.68 | -0.24 |
| Apr | 11.47 | 11.11 | -0.36 |
| May | 11.78 | 11.08 | -0.70 |
| Jun | 11.86 | 11.05 | -0.81 |
| Jul | 11.57 | 10.63 | -0.94 |
| Aug | 11.19 | 10.29 | -0.90 |
| Sep | 11.30 | 10.52 | -0.79 |
| Oct | 10.84 | 10.13 | -0.70 |
| Nov | 10.10 | 9.87 | -0.23 |
| Dec | 9.87 | 9.78 | -0.08 |
| ⌀ Month | 10.99 | 10.47 | -0.52 |
Rain (mm)
| Month | ⌀ 1940 - 1950 | ⌀ 2013 - 2023 | +/- |
|---|---|---|---|
| Jan | 0.01 | 0.00 | -0.01 |
| Feb | 0.00 | 0.00 | 0.00 |
| Mar | 0.01 | 0.00 | -0.01 |
| Apr | 0.02 | 0.01 | -0.01 |
| May | 0.04 | 0.09 | 0.05 |
| Jun | 0.45 | 0.14 | -0.32 |
| Jul | 1.35 | 0.53 | -0.81 |
| Aug | 2.13 | 1.87 | -0.27 |
| Sep | 0.63 | 0.35 | -0.27 |
| Oct | 0.08 | 0.03 | -0.05 |
| Nov | 0.00 | 0.00 | -0.00 |
| Dec | 0.00 | 0.00 | -0.00 |
| ⌀ Month | 0.39 | 0.25 | -0.14 |
Snow (mm)
| Month | ⌀ 1940 - 1950 | ⌀ 2013 - 2023 | +/- |
|---|---|---|---|
| Jan | 0.00 | 0.00 | 0.00 |
| Feb | 0.00 | 0.00 | 0.00 |
| Mar | 0.00 | 0.00 | 0.00 |
| Apr | 0.00 | 0.00 | 0.00 |
| May | 0.00 | 0.00 | 0.00 |
| Jun | 0.00 | 0.00 | 0.00 |
| Jul | 0.00 | 0.00 | 0.00 |
| Aug | 0.00 | 0.00 | 0.00 |
| Sep | 0.00 | 0.00 | 0.00 |
| Oct | 0.00 | 0.00 | 0.00 |
| Nov | 0.00 | 0.00 | 0.00 |
| Dec | 0.00 | 0.00 | 0.00 |
| ⌀ Month | 0.00 | 0.00 | 0.00 |