Climate Change Chart of The Bottom, Bonaire, Sint Eustatius and Saba
Comprehensive Climate Change Chart of The Bottom, Bonaire, Sint Eustatius and Saba: Monthly Averages and Impact Trends
Exploring the changing climate in The Bottom, Bonaire, Sint Eustatius, and Saba reveals fascinating insights into temperature, rainfall, and sunshine duration trends. Dive into the data to understand how climate change is impacting these regions.
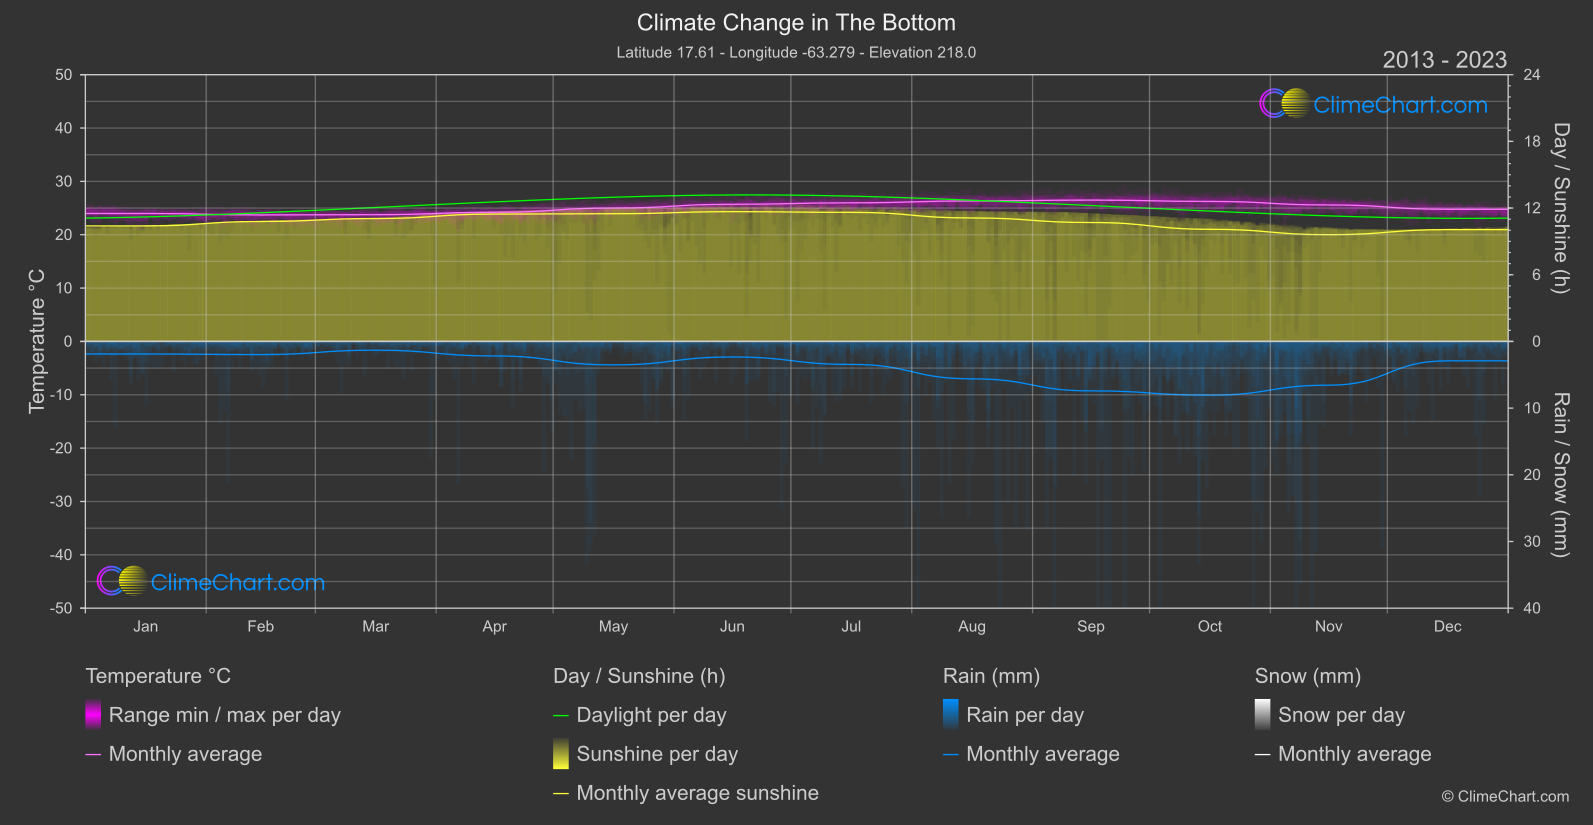
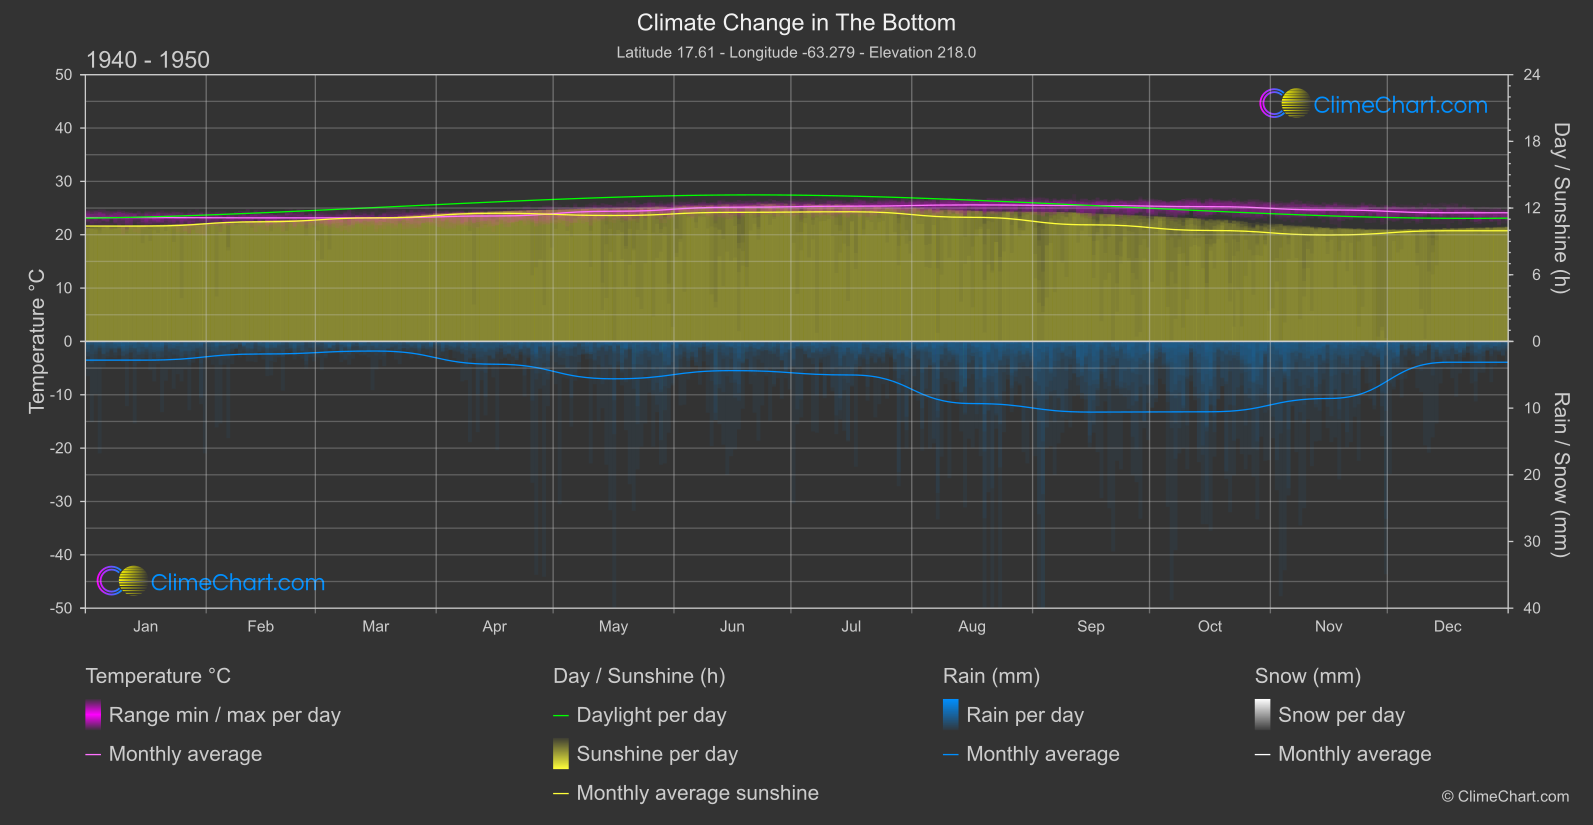
The data comparison between the periods 1940-1950 and 2013-2024 for The Bottom, Bonaire, Sint Eustatius, and Saba reveals significant changes in temperature, rainfall, and sunshine duration. Analyzing the trends, it's evident that September experiences the highest temperature increase of approximately 1.03°C, while April sees the most significant rise in rainfall with a change of around -0.62 mm. When it comes to sunshine duration, May stands out with a notable increase of about 0.16 hours.
Climate Change Data Overview for The Bottom, Bonaire, Sint Eustatius and Saba
Explore the comprehensive climate change data for The Bottom, Bonaire, Sint Eustatius and Saba. This detailed table provides valuable insights into temperature variations, precipitation levels, and seasonal changes influenced by climate change, helping you understand the unique weather patterns of this region.
Temperature °C
| Month | ⌀ 1940 - 1950 | ⌀ 2013 - 2023 | +/- |
|---|---|---|---|
| Jan | 23.22 | 23.98 | 0.76 |
| Feb | 23.16 | 23.71 | 0.55 |
| Mar | 23.17 | 23.76 | 0.59 |
| Apr | 23.52 | 24.20 | 0.68 |
| May | 24.40 | 25.01 | 0.60 |
| Jun | 25.15 | 25.71 | 0.56 |
| Jul | 25.35 | 25.98 | 0.63 |
| Aug | 25.59 | 26.32 | 0.73 |
| Sep | 25.47 | 26.49 | 1.03 |
| Oct | 25.26 | 26.24 | 0.98 |
| Nov | 24.65 | 25.58 | 0.93 |
| Dec | 24.12 | 24.77 | 0.65 |
| ⌀ Month | 24.42 | 25.15 | 0.73 |
Sunshine (h)
| Month | ⌀ 1940 - 1950 | ⌀ 2013 - 2023 | +/- |
|---|---|---|---|
| Jan | 10.38 | 10.40 | 0.01 |
| Feb | 10.76 | 10.79 | 0.03 |
| Mar | 11.12 | 11.06 | -0.06 |
| Apr | 11.53 | 11.46 | -0.07 |
| May | 11.33 | 11.49 | 0.16 |
| Jun | 11.61 | 11.67 | 0.06 |
| Jul | 11.67 | 11.61 | -0.05 |
| Aug | 11.16 | 11.11 | -0.06 |
| Sep | 10.49 | 10.70 | 0.21 |
| Oct | 9.98 | 10.09 | 0.11 |
| Nov | 9.58 | 9.60 | 0.03 |
| Dec | 9.96 | 10.06 | 0.10 |
| ⌀ Month | 10.80 | 10.84 | 0.04 |
Rain (mm)
| Month | ⌀ 1940 - 1950 | ⌀ 2013 - 2023 | +/- |
|---|---|---|---|
| Jan | 1.40 | 0.94 | -0.46 |
| Feb | 0.94 | 0.99 | 0.04 |
| Mar | 0.72 | 0.66 | -0.06 |
| Apr | 1.71 | 1.09 | -0.62 |
| May | 2.80 | 1.76 | -1.04 |
| Jun | 2.19 | 1.17 | -1.02 |
| Jul | 2.52 | 1.72 | -0.79 |
| Aug | 4.66 | 2.81 | -1.85 |
| Sep | 5.30 | 3.71 | -1.59 |
| Oct | 5.27 | 4.03 | -1.25 |
| Nov | 4.28 | 3.28 | -1.00 |
| Dec | 1.56 | 1.45 | -0.11 |
| ⌀ Month | 2.78 | 1.97 | -0.81 |
Snow (mm)
| Month | ⌀ 1940 - 1950 | ⌀ 2013 - 2023 | +/- |
|---|---|---|---|
| Jan | 0.00 | 0.00 | 0.00 |
| Feb | 0.00 | 0.00 | 0.00 |
| Mar | 0.00 | 0.00 | 0.00 |
| Apr | 0.00 | 0.00 | 0.00 |
| May | 0.00 | 0.00 | 0.00 |
| Jun | 0.00 | 0.00 | 0.00 |
| Jul | 0.00 | 0.00 | 0.00 |
| Aug | 0.00 | 0.00 | 0.00 |
| Sep | 0.00 | 0.00 | 0.00 |
| Oct | 0.00 | 0.00 | 0.00 |
| Nov | 0.00 | 0.00 | 0.00 |
| Dec | 0.00 | 0.00 | 0.00 |
| ⌀ Month | 0.00 | 0.00 | 0.00 |