Climate Change Chart of Tagaytay City, Philippines
Comprehensive Climate Change Chart of Tagaytay City, Philippines: Monthly Averages and Impact Trends
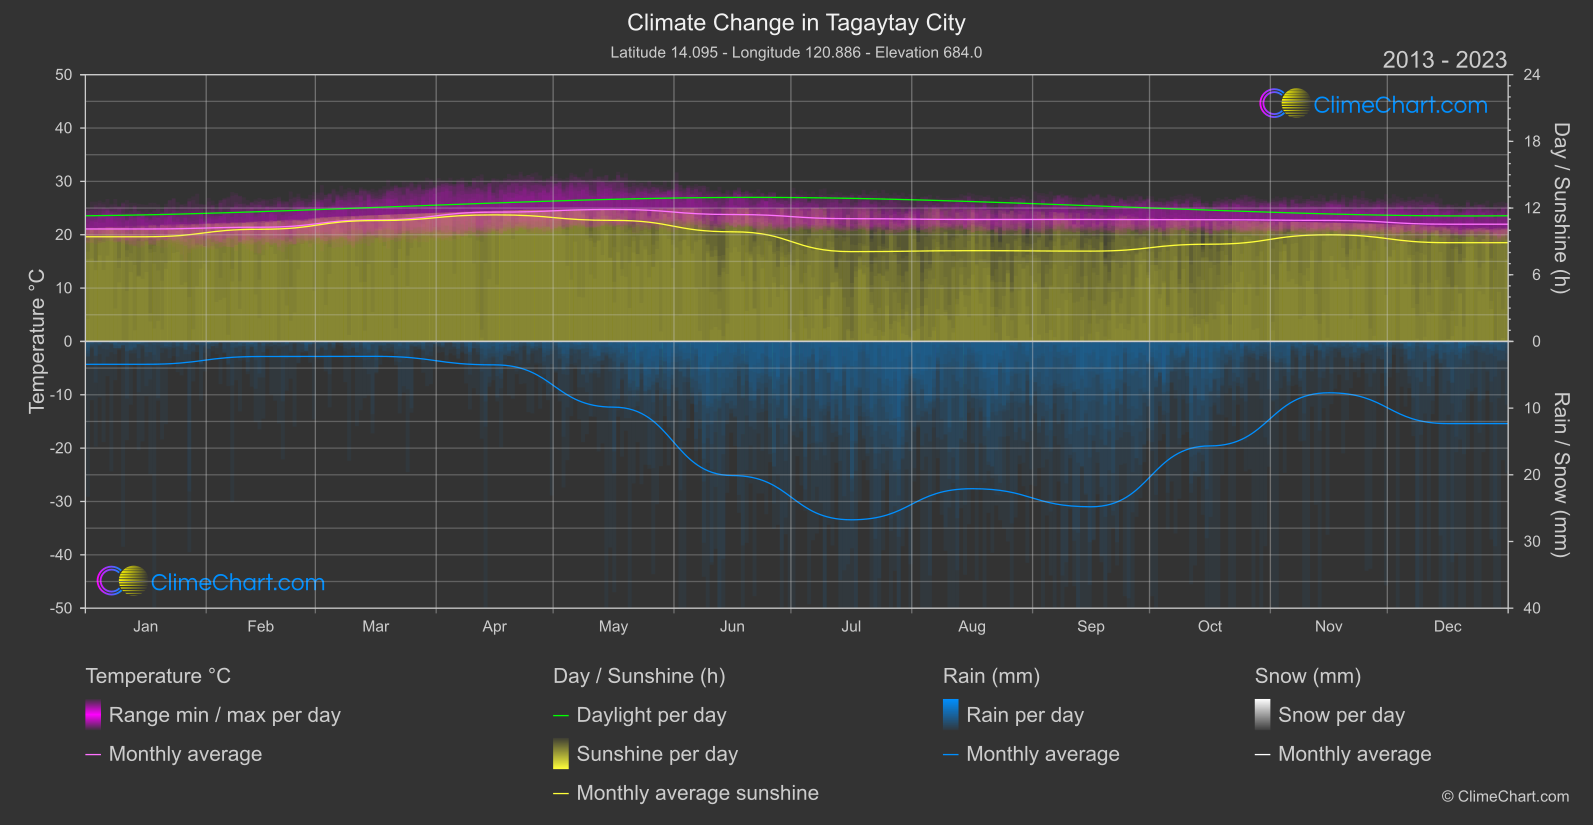
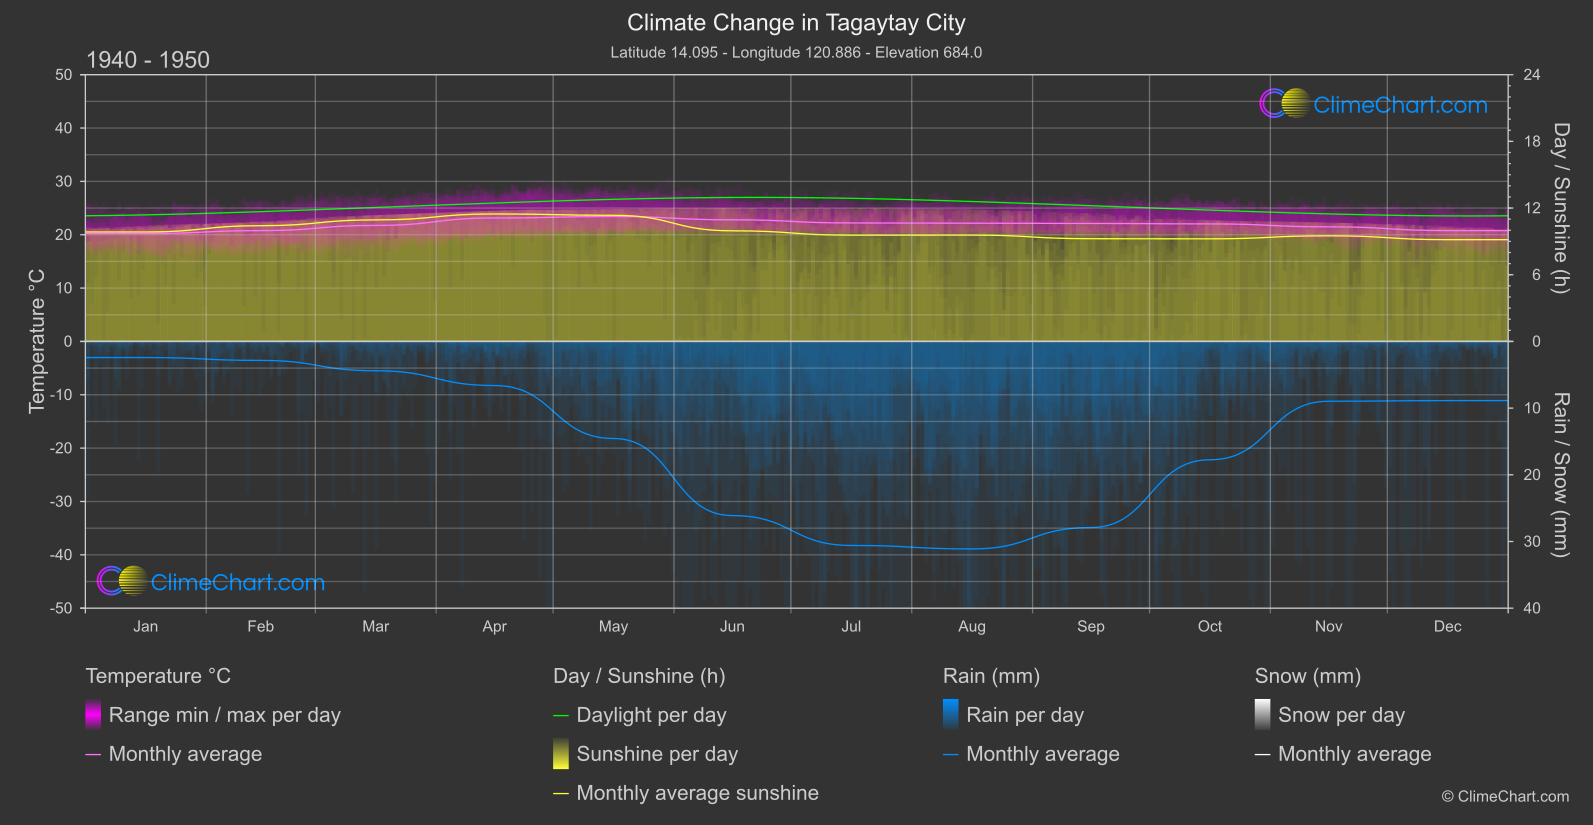
For Tagaytay City, Philippines, the climate data compare 1940–1950 with 2013–2023.
Mean daily rainfall, averaged across calendar months, had a difference of -1.31 mm/day compared with the earlier reference period. This is an unweighted average of monthly means, not an annual total or a day-weighted average, and it does not describe the change in every individual month.
Overview of climate changes
Changes in rainfall
Mean daily rainfall, averaged across calendar months, had a difference of -1.31 mm/day compared with the earlier reference period. This is an unweighted average of monthly means, not an annual total or a day-weighted average, and it does not describe the change in every individual month. The largest monthly decrease was in August, with a difference of -4.52 mm/day in mean daily rainfall. In contrast, December had the largest monthly increase, at +1.72 mm/day; these identify the strongest reported decreases and increases, not the pattern in every month.
Changes in sunshine duration
Mean daily sunshine duration averaged across calendar months had a difference of -0.51 hours/day. This unweighted mean summarizes the monthly averages; it is not a day-weighted annual figure and does not mean that each month had the same change. The largest monthly decrease in mean daily sunshine was in July, at -1.48 hours/day. The largest monthly increase came in November, with a difference of +0.09 hours/day, showing that the monthly changes were not uniform.
Temperature changes
The mean difference in monthly mean temperature, averaged across calendar months, was an increase of +0.95 °C compared with the earlier reference period; this is an unweighted mean of monthly means, not a day-weighted annual average or a measure of daytime maximum temperatures. The largest monthly increase was in May, at +1.32 °C. That marks the strongest increase among the reported monthly differences, rather than implying that every month changed by the same amount.
Climate Change Data Overview for Tagaytay City, Philippines
Explore the comprehensive climate change data for Tagaytay City, Philippines. This detailed table provides valuable insights into temperature variations, precipitation levels, and seasonal changes influenced by climate change, helping you understand the unique weather patterns of this region.
Temperature °C
| Month | ⌀ 1940 - 1950 | ⌀ 2013 - 2023 | +/- |
|---|---|---|---|
| Jan | 20.23 | 21.08 | 0.85 |
| Feb | 20.77 | 21.41 | 0.64 |
| Mar | 21.75 | 22.80 | 1.05 |
| Apr | 23.14 | 24.24 | 1.10 |
| May | 23.42 | 24.74 | 1.32 |
| Jun | 22.79 | 23.79 | 0.99 |
| Jul | 22.21 | 23.01 | 0.80 |
| Aug | 22.16 | 22.86 | 0.70 |
| Sep | 22.11 | 22.86 | 0.75 |
| Oct | 22.03 | 22.81 | 0.78 |
| Nov | 21.48 | 22.69 | 1.20 |
| Dec | 20.77 | 21.98 | 1.20 |
| ⌀ Month | 21.90 | 22.85 | 0.95 |
Sunshine (h) / day
| Month | ⌀ 1940 - 1950 | ⌀ 2013 - 2023 | +/- |
|---|---|---|---|
| Jan | 9.85 | 9.42 | -0.43 |
| Feb | 10.41 | 10.09 | -0.32 |
| Mar | 10.94 | 10.87 | -0.06 |
| Apr | 11.47 | 11.39 | -0.08 |
| May | 11.35 | 10.89 | -0.46 |
| Jun | 9.95 | 9.86 | -0.09 |
| Jul | 9.56 | 8.08 | -1.48 |
| Aug | 9.57 | 8.17 | -1.40 |
| Sep | 9.24 | 8.13 | -1.12 |
| Oct | 9.23 | 8.75 | -0.48 |
| Nov | 9.50 | 9.60 | 0.09 |
| Dec | 9.16 | 8.88 | -0.27 |
| ⌀ Month | 10.02 | 9.51 | -0.51 |
Rain (mm) / day
| Month | ⌀ 1940 - 1950 | ⌀ 2013 - 2023 | +/- |
|---|---|---|---|
| Jan | 1.21 | 1.71 | 0.51 |
| Feb | 1.42 | 1.13 | -0.29 |
| Mar | 2.20 | 1.12 | -1.08 |
| Apr | 3.31 | 1.76 | -1.55 |
| May | 7.28 | 4.93 | -2.35 |
| Jun | 13.06 | 10.06 | -3.00 |
| Jul | 15.30 | 13.37 | -1.92 |
| Aug | 15.56 | 11.04 | -4.52 |
| Sep | 13.95 | 12.40 | -1.56 |
| Oct | 8.87 | 7.83 | -1.04 |
| Nov | 4.48 | 3.85 | -0.63 |
| Dec | 4.44 | 6.16 | 1.72 |
| ⌀ Month | 7.59 | 6.28 | -1.31 |
Snow (mm) / day
| Month | ⌀ 1940 - 1950 | ⌀ 2013 - 2023 | +/- |
|---|---|---|---|
| Jan | 0.00 | 0.00 | 0.00 |
| Feb | 0.00 | 0.00 | 0.00 |
| Mar | 0.00 | 0.00 | 0.00 |
| Apr | 0.00 | 0.00 | 0.00 |
| May | 0.00 | 0.00 | 0.00 |
| Jun | 0.00 | 0.00 | 0.00 |
| Jul | 0.00 | 0.00 | 0.00 |
| Aug | 0.00 | 0.00 | 0.00 |
| Sep | 0.00 | 0.00 | 0.00 |
| Oct | 0.00 | 0.00 | 0.00 |
| Nov | 0.00 | 0.00 | 0.00 |
| Dec | 0.00 | 0.00 | 0.00 |
| ⌀ Month | 0.00 | 0.00 | 0.00 |