Climate Change Chart of Seychelles, Seychelles
Comprehensive Climate Change Chart of Seychelles, Seychelles: Monthly Averages and Impact Trends
Exploring the changing climate in Seychelles
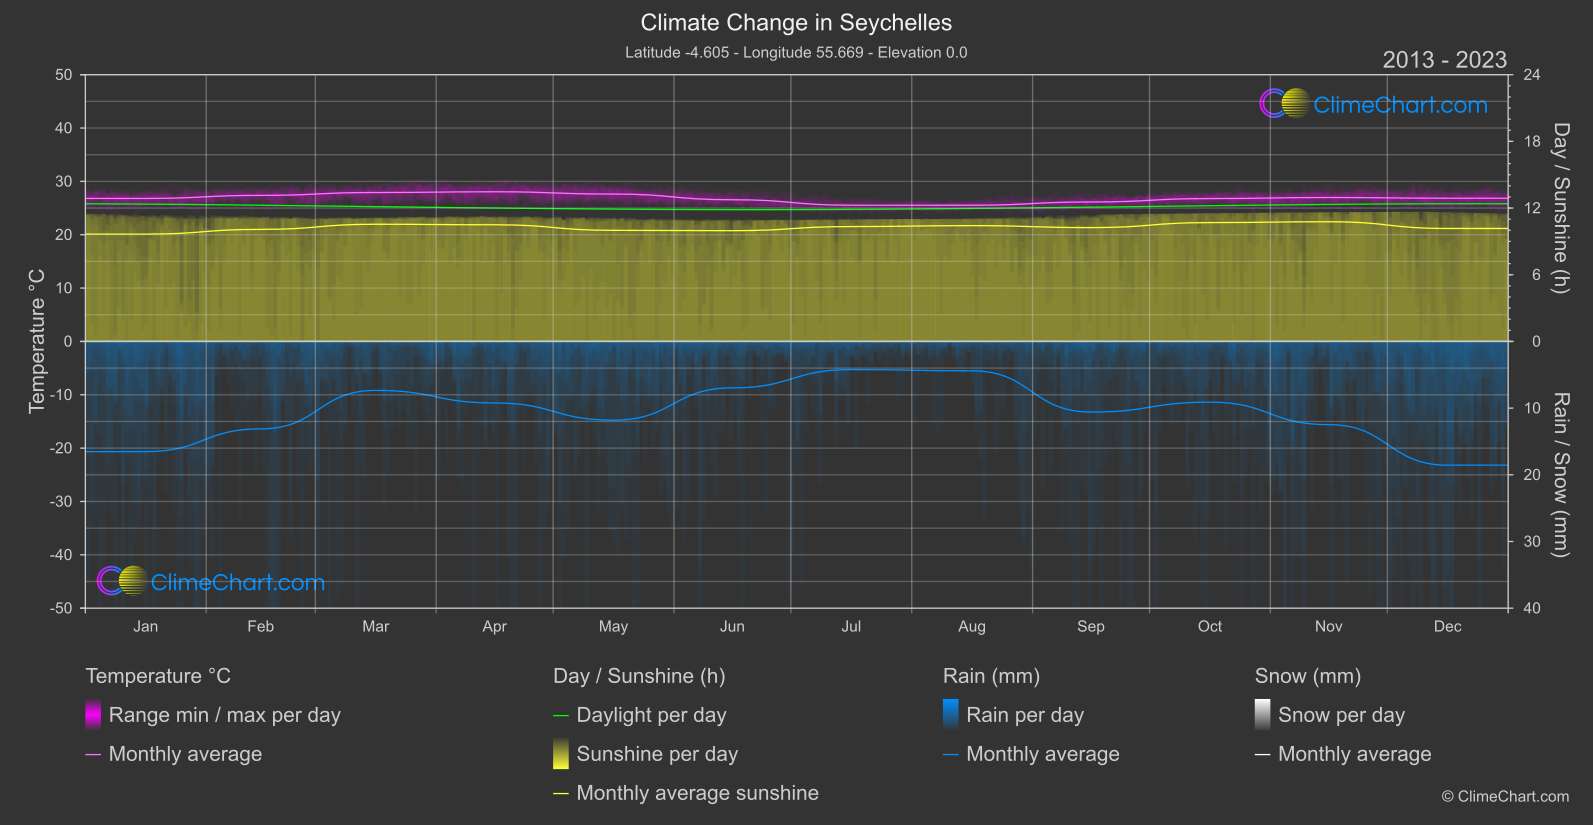
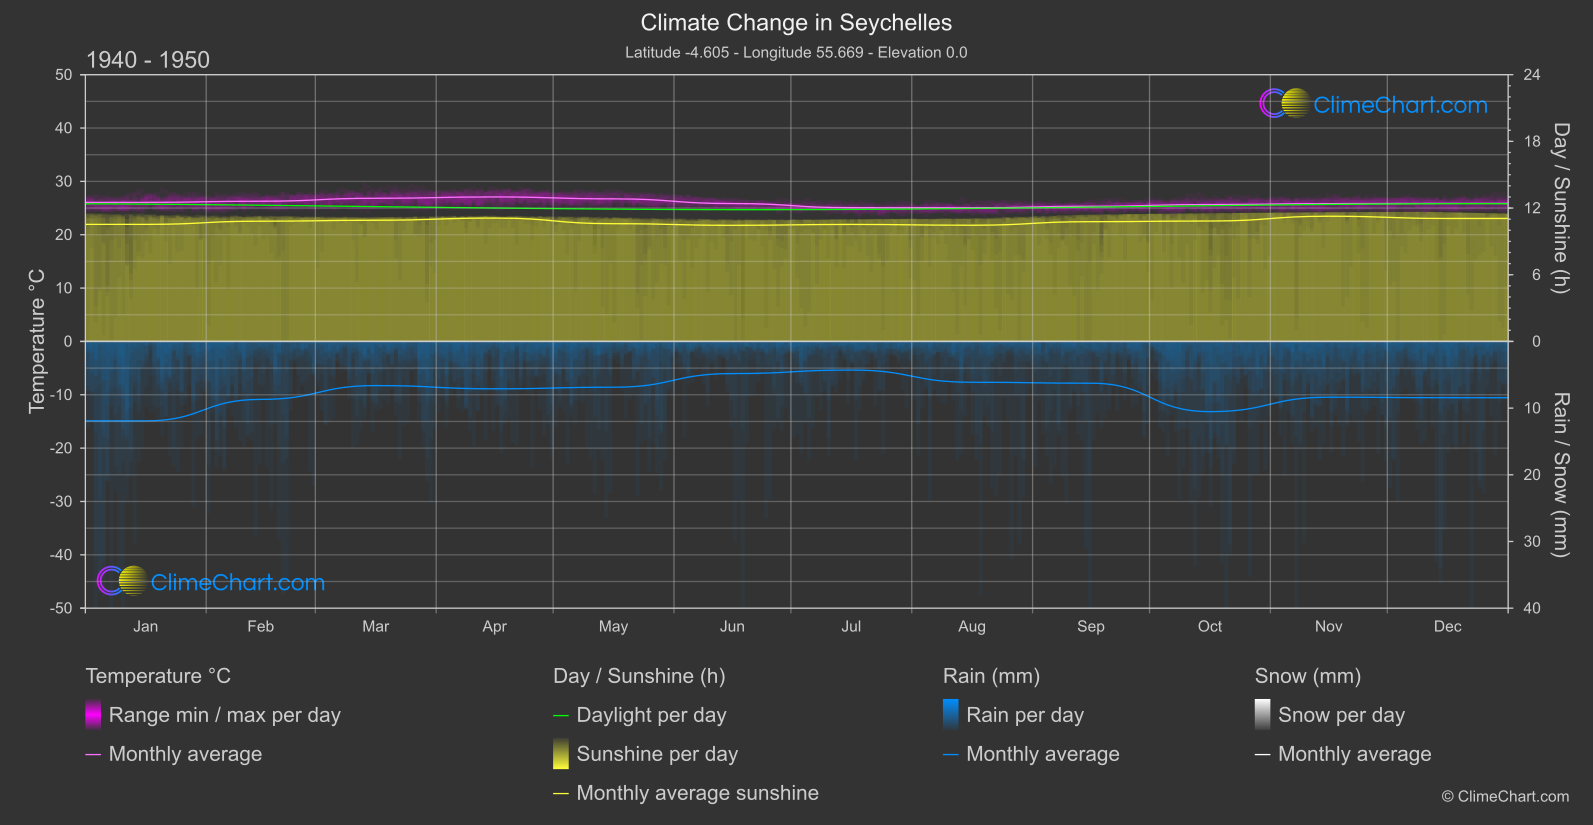
Seychelles, an archipelago nation in the Indian Ocean, has been experiencing notable changes in its climate over the years. Analyzing the temperature, rainfall, and sunshine duration data from the periods 1940-1950 and 2013-2024 provides valuable insights into these changes. For instance, the month of December shows a significant increase in temperature and rainfall compared to the historical data.
Climate Change Data Overview for Seychelles, Seychelles
Explore the comprehensive climate change data for Seychelles, Seychelles. This detailed table provides valuable insights into temperature variations, precipitation levels, and seasonal changes influenced by climate change, helping you understand the unique weather patterns of this region.
Temperature °C
| Month | ⌀ 1940 - 1950 | ⌀ 2013 - 2023 | +/- |
|---|---|---|---|
| Jan | 26.07 | 26.80 | 0.74 |
| Feb | 26.28 | 27.38 | 1.10 |
| Mar | 26.83 | 27.92 | 1.08 |
| Apr | 27.08 | 28.05 | 0.97 |
| May | 26.72 | 27.62 | 0.90 |
| Jun | 25.85 | 26.56 | 0.71 |
| Jul | 25.07 | 25.53 | 0.45 |
| Aug | 25.05 | 25.53 | 0.48 |
| Sep | 25.34 | 26.14 | 0.80 |
| Oct | 25.65 | 26.78 | 1.13 |
| Nov | 25.83 | 26.98 | 1.15 |
| Dec | 25.88 | 26.84 | 0.96 |
| ⌀ Month | 25.97 | 26.85 | 0.87 |
Sunshine (h)
| Month | ⌀ 1940 - 1950 | ⌀ 2013 - 2023 | +/- |
|---|---|---|---|
| Jan | 10.53 | 9.66 | -0.88 |
| Feb | 10.82 | 10.08 | -0.74 |
| Mar | 10.90 | 10.54 | -0.36 |
| Apr | 11.10 | 10.50 | -0.60 |
| May | 10.59 | 9.99 | -0.60 |
| Jun | 10.45 | 9.96 | -0.49 |
| Jul | 10.53 | 10.33 | -0.19 |
| Aug | 10.45 | 10.42 | -0.04 |
| Sep | 10.77 | 10.24 | -0.53 |
| Oct | 10.83 | 10.69 | -0.14 |
| Nov | 11.26 | 10.77 | -0.49 |
| Dec | 11.06 | 10.16 | -0.90 |
| ⌀ Month | 10.78 | 10.28 | -0.50 |
Rain (mm)
| Month | ⌀ 1940 - 1950 | ⌀ 2013 - 2023 | +/- |
|---|---|---|---|
| Jan | 5.95 | 8.26 | 2.31 |
| Feb | 4.35 | 6.56 | 2.21 |
| Mar | 3.31 | 3.67 | 0.36 |
| Apr | 3.55 | 4.61 | 1.06 |
| May | 3.43 | 5.90 | 2.47 |
| Jun | 2.41 | 3.48 | 1.07 |
| Jul | 2.15 | 2.11 | -0.04 |
| Aug | 3.06 | 2.21 | -0.86 |
| Sep | 3.13 | 5.29 | 2.16 |
| Oct | 5.26 | 4.55 | -0.71 |
| Nov | 4.18 | 6.24 | 2.06 |
| Dec | 4.22 | 9.28 | 5.06 |
| ⌀ Month | 3.75 | 5.18 | 1.43 |
Snow (mm)
| Month | ⌀ 1940 - 1950 | ⌀ 2013 - 2023 | +/- |
|---|---|---|---|
| Jan | 0.00 | 0.00 | 0.00 |
| Feb | 0.00 | 0.00 | 0.00 |
| Mar | 0.00 | 0.00 | 0.00 |
| Apr | 0.00 | 0.00 | 0.00 |
| May | 0.00 | 0.00 | 0.00 |
| Jun | 0.00 | 0.00 | 0.00 |
| Jul | 0.00 | 0.00 | 0.00 |
| Aug | 0.00 | 0.00 | 0.00 |
| Sep | 0.00 | 0.00 | 0.00 |
| Oct | 0.00 | 0.00 | 0.00 |
| Nov | 0.00 | 0.00 | 0.00 |
| Dec | 0.00 | 0.00 | 0.00 |
| ⌀ Month | 0.00 | 0.00 | 0.00 |