Climate Change Chart of San Marino, San Marino
Comprehensive Climate Change Chart of San Marino, San Marino: Monthly Averages and Impact Trends
Explore the changing climate in San Marino, as we delve into temperature, rainfall, snowfall, and sunshine duration data from 1940 - 1950 compared to 2013 - 2024.

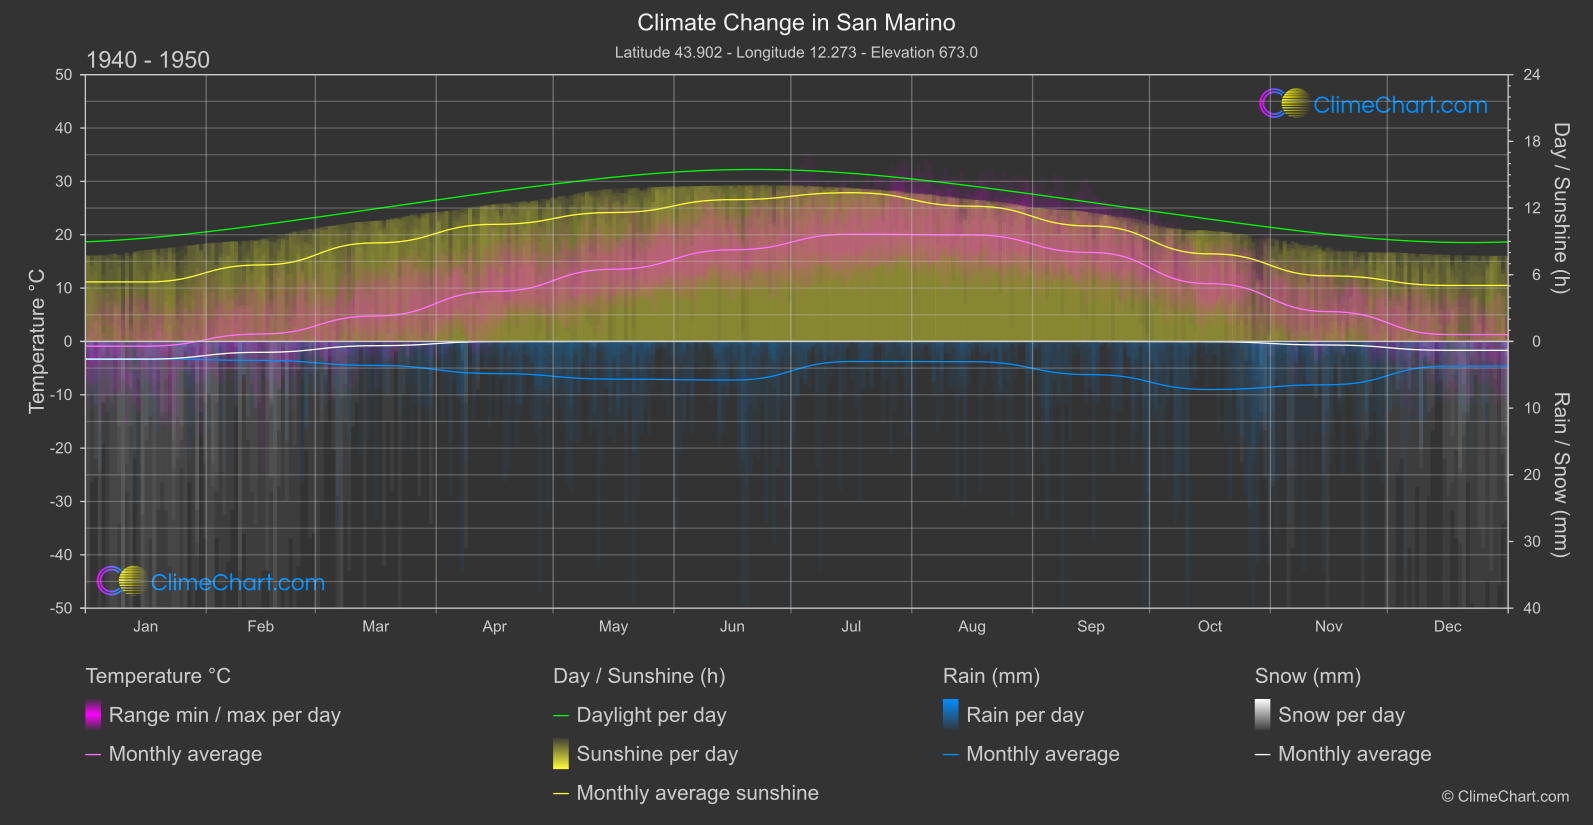
San Marino's climate has undergone significant changes over the years. The data reveals interesting patterns, with certain months experiencing more pronounced shifts in temperature, rainfall, snowfall, and sunshine duration. For example, the month with the highest temperature change is [Month] with a temperature change of [Highest Temperature Change]. Similarly, the month with the highest rainfall change is [Month] with a rainfall change of [Highest Rainfall Change]. These insights help us understand the evolving climate in San Marino and its impact on the environment and daily life.
Climate Change Data Overview for San Marino, San Marino
Explore the comprehensive climate change data for San Marino, San Marino. This detailed table provides valuable insights into temperature variations, precipitation levels, and seasonal changes influenced by climate change, helping you understand the unique weather patterns of this region.
Temperature °C
| Month | ⌀ 1940 - 1950 | ⌀ 2013 - 2023 | +/- |
|---|---|---|---|
| Jan | -0.88 | 2.97 | 3.85 |
| Feb | 1.39 | 4.23 | 2.84 |
| Mar | 4.77 | 6.27 | 1.50 |
| Apr | 9.37 | 9.99 | 0.62 |
| May | 13.54 | 13.77 | 0.23 |
| Jun | 17.17 | 19.21 | 2.04 |
| Jul | 20.11 | 22.06 | 1.95 |
| Aug | 19.96 | 21.42 | 1.46 |
| Sep | 16.67 | 16.95 | 0.28 |
| Oct | 10.83 | 13.03 | 2.20 |
| Nov | 5.60 | 8.16 | 2.56 |
| Dec | 1.29 | 4.60 | 3.32 |
| ⌀ Month | 9.98 | 11.89 | 1.90 |
Sunshine (h)
| Month | ⌀ 1940 - 1950 | ⌀ 2013 - 2023 | +/- |
|---|---|---|---|
| Jan | 5.35 | 5.53 | 0.18 |
| Feb | 6.88 | 6.69 | -0.19 |
| Mar | 8.86 | 8.65 | -0.21 |
| Apr | 10.54 | 10.28 | -0.26 |
| May | 11.60 | 10.84 | -0.75 |
| Jun | 12.76 | 12.89 | 0.13 |
| Jul | 13.38 | 13.16 | -0.23 |
| Aug | 12.17 | 11.98 | -0.19 |
| Sep | 10.38 | 10.00 | -0.39 |
| Oct | 7.88 | 7.93 | 0.05 |
| Nov | 5.89 | 5.46 | -0.43 |
| Dec | 5.04 | 5.67 | 0.63 |
| ⌀ Month | 9.23 | 9.09 | -0.14 |
Rain (mm)
| Month | ⌀ 1940 - 1950 | ⌀ 2013 - 2023 | +/- |
|---|---|---|---|
| Jan | 1.31 | 1.69 | 0.37 |
| Feb | 1.42 | 2.46 | 1.03 |
| Mar | 1.80 | 2.54 | 0.74 |
| Apr | 2.41 | 2.66 | 0.25 |
| May | 2.83 | 4.34 | 1.51 |
| Jun | 2.90 | 2.42 | -0.48 |
| Jul | 1.50 | 1.93 | 0.43 |
| Aug | 1.52 | 2.36 | 0.84 |
| Sep | 2.49 | 2.99 | 0.50 |
| Oct | 3.61 | 3.33 | -0.27 |
| Nov | 3.25 | 4.08 | 0.84 |
| Dec | 1.85 | 1.86 | 0.01 |
| ⌀ Month | 2.24 | 2.72 | 0.48 |
Snow (mm)
| Month | ⌀ 1940 - 1950 | ⌀ 2013 - 2023 | +/- |
|---|---|---|---|
| Jan | 1.33 | 0.89 | -0.44 |
| Feb | 0.82 | 0.98 | 0.17 |
| Mar | 0.32 | 0.37 | 0.06 |
| Apr | 0.02 | 0.04 | 0.02 |
| May | 0.00 | 0.00 | 0.00 |
| Jun | 0.00 | 0.00 | 0.00 |
| Jul | 0.00 | 0.00 | 0.00 |
| Aug | 0.00 | 0.00 | 0.00 |
| Sep | 0.00 | 0.00 | 0.00 |
| Oct | 0.02 | 0.00 | -0.02 |
| Nov | 0.27 | 0.22 | -0.04 |
| Dec | 0.67 | 0.25 | -0.42 |
| ⌀ Month | 0.29 | 0.23 | -0.06 |