Climate Change Chart of Monaco, Monaco
Comprehensive Climate Change Chart of Monaco, Monaco: Monthly Averages and Impact Trends
Exploring the climate change data in Monaco reveals intriguing insights into the shifting weather patterns over the years.
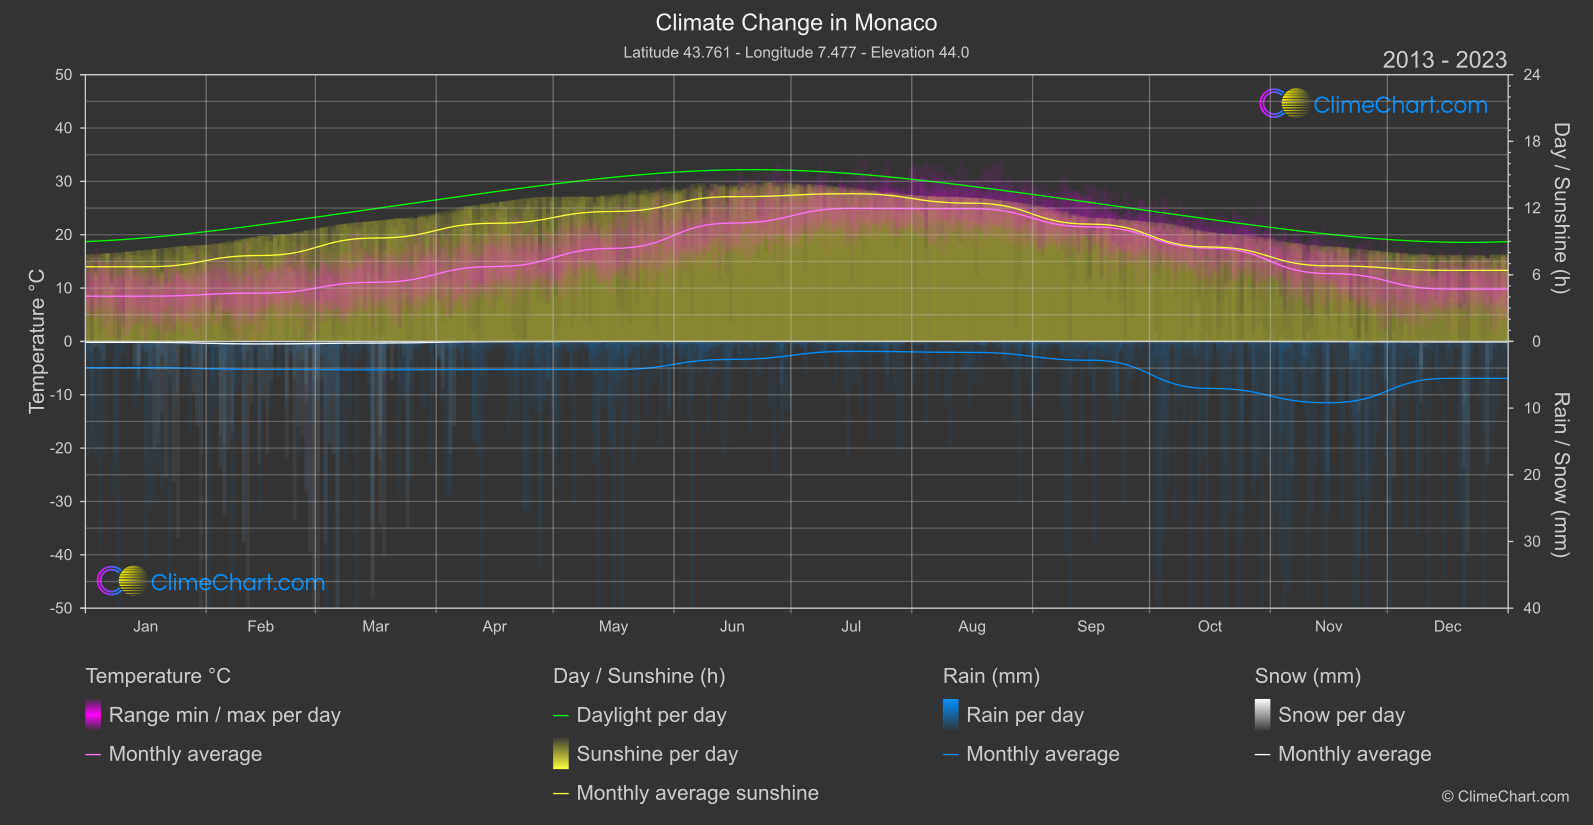
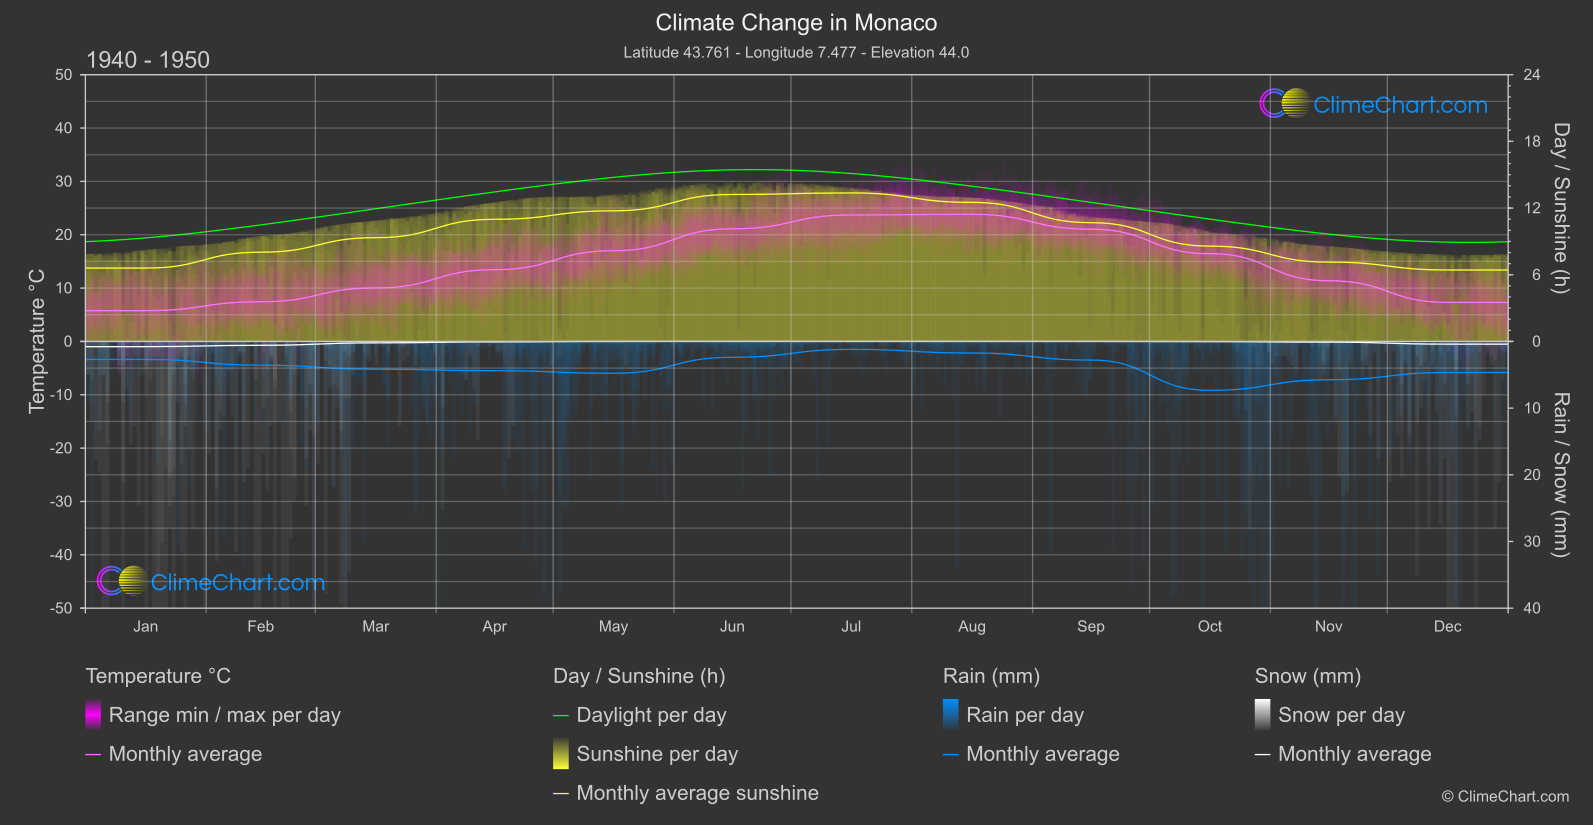
Monaco's climate has undergone significant changes in temperature, rainfall, snowfall, and sunshine duration over the years. Analyzing the data reveals interesting patterns, such as the month with the highest temperature change or rainfall fluctuation. Understanding these climate shifts is crucial for adapting and mitigating the effects of climate change in Monaco.
Climate Change Data Overview for Monaco, Monaco
Explore the comprehensive climate change data for Monaco, Monaco. This detailed table provides valuable insights into temperature variations, precipitation levels, and seasonal changes influenced by climate change, helping you understand the unique weather patterns of this region.
Temperature °C
| Month | ⌀ 1940 - 1950 | ⌀ 2013 - 2023 | +/- |
|---|---|---|---|
| Jan | 5.77 | 8.48 | 2.71 |
| Feb | 7.44 | 9.06 | 1.63 |
| Mar | 10.03 | 11.09 | 1.07 |
| Apr | 13.45 | 14.04 | 0.59 |
| May | 17.00 | 17.45 | 0.45 |
| Jun | 21.11 | 22.19 | 1.08 |
| Jul | 23.70 | 24.94 | 1.24 |
| Aug | 23.83 | 24.88 | 1.06 |
| Sep | 21.04 | 21.46 | 0.43 |
| Oct | 16.45 | 17.50 | 1.06 |
| Nov | 11.38 | 12.73 | 1.35 |
| Dec | 7.32 | 9.82 | 2.50 |
| ⌀ Month | 14.88 | 16.14 | 1.26 |
Sunshine (h)
| Month | ⌀ 1940 - 1950 | ⌀ 2013 - 2023 | +/- |
|---|---|---|---|
| Jan | 6.60 | 6.72 | 0.12 |
| Feb | 8.03 | 7.73 | -0.30 |
| Mar | 9.34 | 9.31 | -0.03 |
| Apr | 10.99 | 10.63 | -0.36 |
| May | 11.75 | 11.69 | -0.06 |
| Jun | 13.22 | 13.02 | -0.20 |
| Jul | 13.36 | 13.29 | -0.07 |
| Aug | 12.51 | 12.44 | -0.07 |
| Sep | 10.69 | 10.55 | -0.13 |
| Oct | 8.57 | 8.50 | -0.08 |
| Nov | 7.14 | 6.80 | -0.34 |
| Dec | 6.43 | 6.39 | -0.03 |
| ⌀ Month | 9.89 | 9.76 | -0.13 |
Rain (mm)
| Month | ⌀ 1940 - 1950 | ⌀ 2013 - 2023 | +/- |
|---|---|---|---|
| Jan | 1.35 | 1.97 | 0.62 |
| Feb | 1.78 | 2.10 | 0.31 |
| Mar | 2.08 | 2.13 | 0.05 |
| Apr | 2.19 | 2.10 | -0.09 |
| May | 2.39 | 2.11 | -0.27 |
| Jun | 1.19 | 1.34 | 0.16 |
| Jul | 0.59 | 0.74 | 0.15 |
| Aug | 0.87 | 0.82 | -0.05 |
| Sep | 1.40 | 1.41 | 0.01 |
| Oct | 3.67 | 3.52 | -0.14 |
| Nov | 2.87 | 4.60 | 1.72 |
| Dec | 2.33 | 2.77 | 0.44 |
| ⌀ Month | 1.89 | 2.14 | 0.24 |
Snow (mm)
| Month | ⌀ 1940 - 1950 | ⌀ 2013 - 2023 | +/- |
|---|---|---|---|
| Jan | 0.39 | 0.07 | -0.32 |
| Feb | 0.29 | 0.19 | -0.10 |
| Mar | 0.11 | 0.12 | 0.01 |
| Apr | 0.03 | 0.01 | -0.02 |
| May | 0.00 | 0.00 | -0.00 |
| Jun | 0.00 | 0.00 | 0.00 |
| Jul | 0.00 | 0.00 | 0.00 |
| Aug | 0.00 | 0.00 | 0.00 |
| Sep | 0.00 | 0.00 | 0.00 |
| Oct | 0.01 | 0.00 | -0.01 |
| Nov | 0.05 | 0.01 | -0.04 |
| Dec | 0.20 | 0.04 | -0.17 |
| ⌀ Month | 0.09 | 0.04 | -0.05 |