Climate Change Chart of Luxembourg, Luxembourg
Comprehensive Climate Change Chart of Luxembourg, Luxembourg: Monthly Averages and Impact Trends
Exploring the climate change data of Luxembourg reveals intriguing trends in temperature, rainfall, snowfall, and sunshine duration over the years.
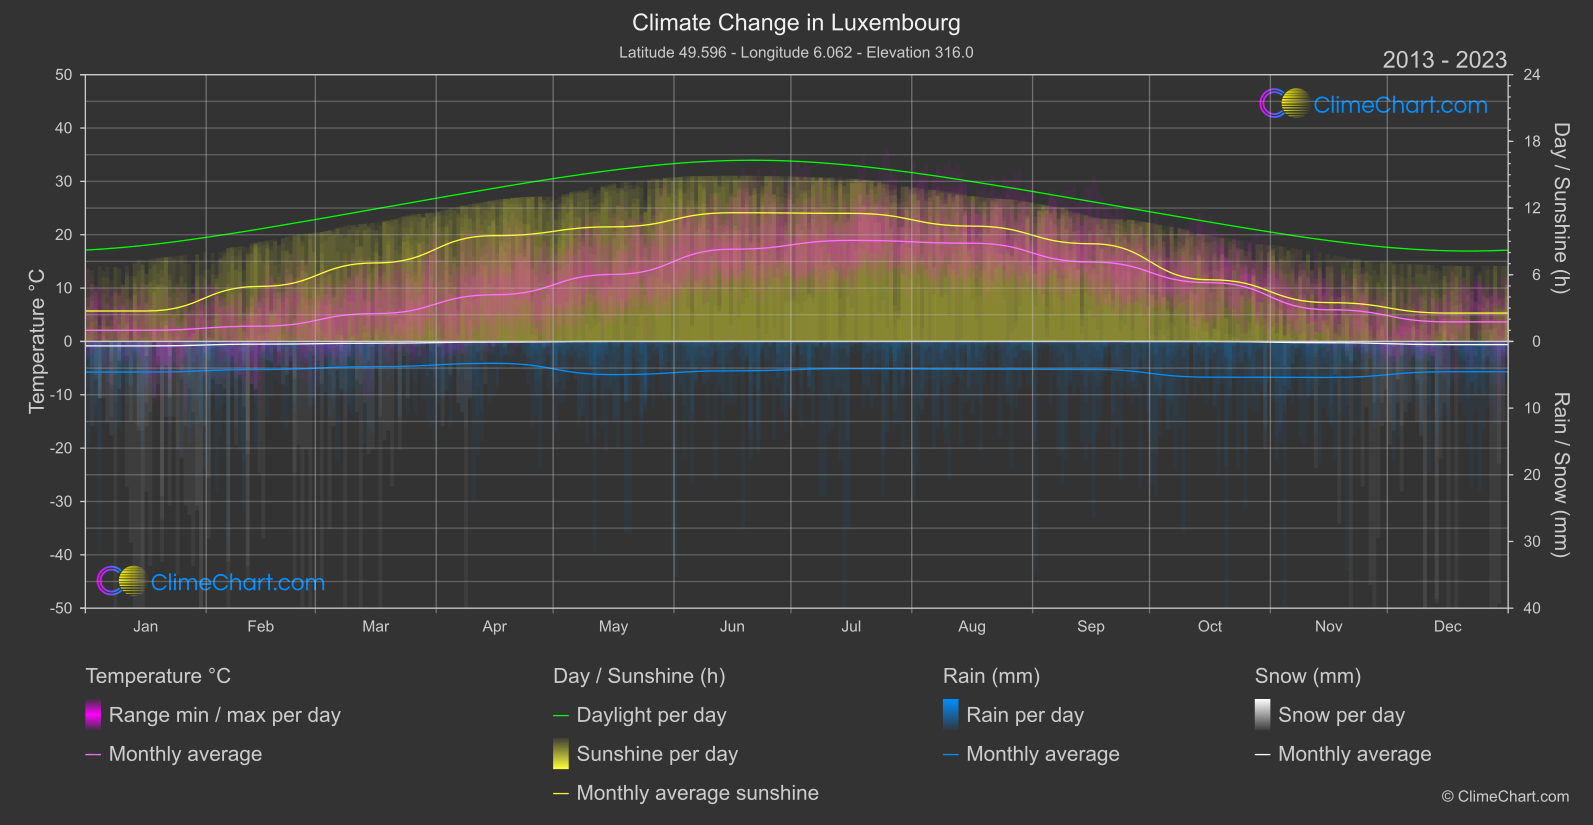
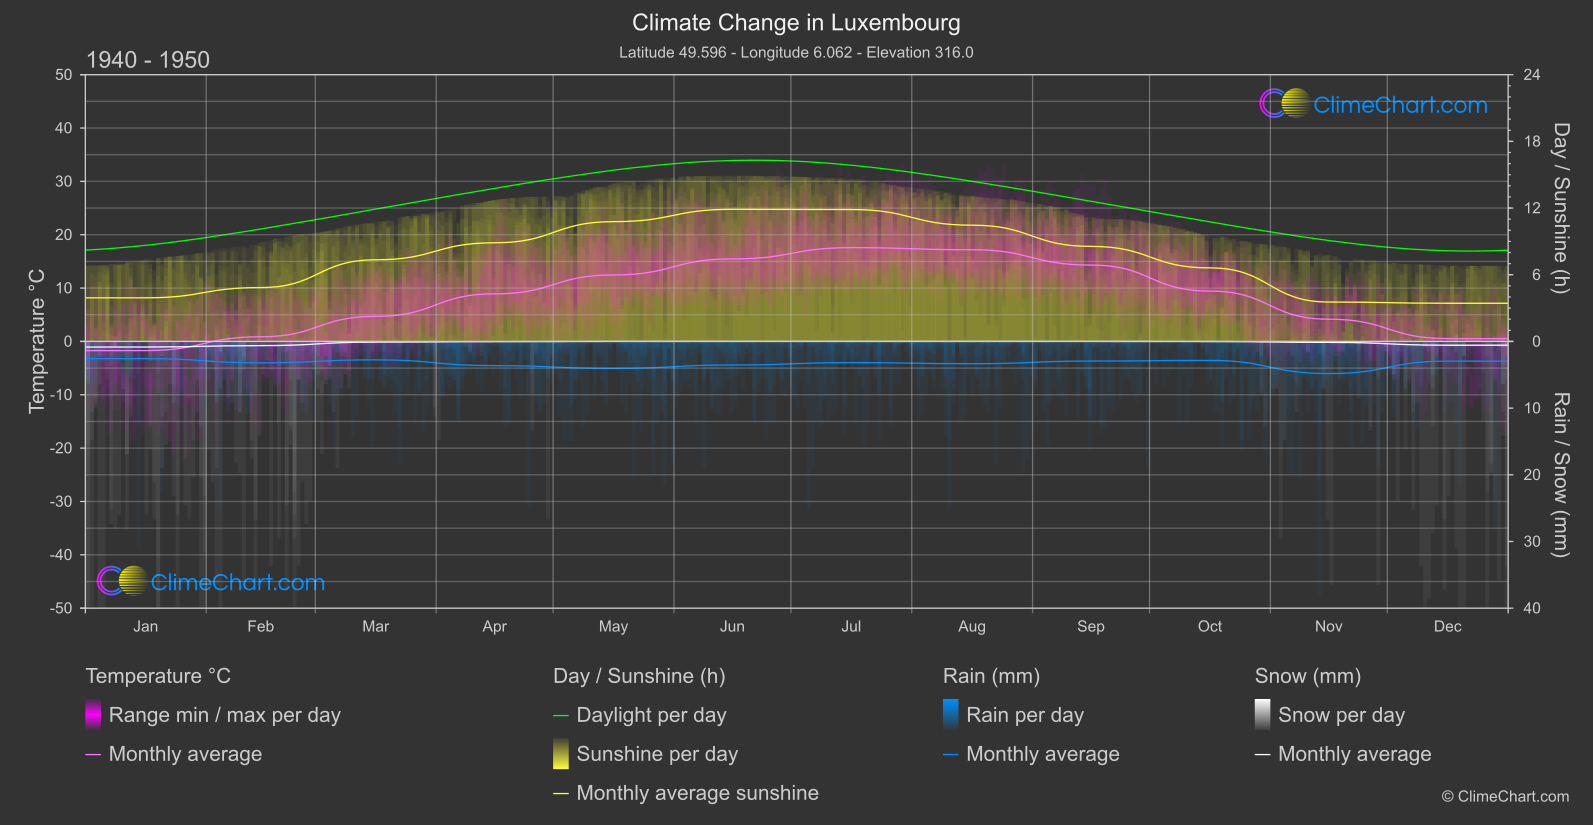
Luxembourg's climate has been experiencing notable changes in temperature, rainfall, snowfall, and sunshine duration. Analysis of the data from the 1940s to 1950s compared to recent years from 2013 to 2024 reveals interesting insights. For instance, June shows a significant temperature increase, while October experiences a considerable rise in rainfall. Snowfall has generally decreased over the years, with minimal to no snow recorded in several months. Moreover, there have been fluctuations in sunshine duration, with some months showing a decrease in sunlight hours compared to the past.
Climate Change Data Overview for Luxembourg, Luxembourg
Explore the comprehensive climate change data for Luxembourg, Luxembourg. This detailed table provides valuable insights into temperature variations, precipitation levels, and seasonal changes influenced by climate change, helping you understand the unique weather patterns of this region.
Temperature °C
| Month | ⌀ 1940 - 1950 | ⌀ 2013 - 2023 | +/- |
|---|---|---|---|
| Jan | -1.72 | 2.09 | 3.80 |
| Feb | 0.87 | 2.86 | 1.99 |
| Mar | 4.70 | 5.22 | 0.52 |
| Apr | 8.92 | 8.75 | -0.17 |
| May | 12.46 | 12.57 | 0.10 |
| Jun | 15.47 | 17.29 | 1.82 |
| Jul | 17.58 | 18.94 | 1.36 |
| Aug | 17.19 | 18.41 | 1.22 |
| Sep | 14.32 | 14.89 | 0.57 |
| Oct | 9.44 | 11.01 | 1.57 |
| Nov | 4.16 | 5.94 | 1.78 |
| Dec | 0.53 | 3.67 | 3.14 |
| ⌀ Month | 8.66 | 10.14 | 1.48 |
Sunshine (h)
| Month | ⌀ 1940 - 1950 | ⌀ 2013 - 2023 | +/- |
|---|---|---|---|
| Jan | 3.92 | 2.74 | -1.19 |
| Feb | 4.85 | 4.95 | 0.11 |
| Mar | 7.34 | 7.06 | -0.28 |
| Apr | 8.88 | 9.52 | 0.64 |
| May | 10.78 | 10.31 | -0.47 |
| Jun | 11.89 | 11.58 | -0.31 |
| Jul | 11.87 | 11.52 | -0.34 |
| Aug | 10.46 | 10.38 | -0.08 |
| Sep | 8.55 | 8.79 | 0.24 |
| Oct | 6.62 | 5.55 | -1.07 |
| Nov | 3.54 | 3.49 | -0.05 |
| Dec | 3.43 | 2.55 | -0.88 |
| ⌀ Month | 7.68 | 7.37 | -0.31 |
Rain (mm)
| Month | ⌀ 1940 - 1950 | ⌀ 2013 - 2023 | +/- |
|---|---|---|---|
| Jan | 1.29 | 2.30 | 1.01 |
| Feb | 1.60 | 2.11 | 0.50 |
| Mar | 1.38 | 1.89 | 0.51 |
| Apr | 1.82 | 1.64 | -0.17 |
| May | 2.02 | 2.49 | 0.47 |
| Jun | 1.77 | 2.20 | 0.43 |
| Jul | 1.59 | 2.04 | 0.45 |
| Aug | 1.67 | 2.08 | 0.41 |
| Sep | 1.47 | 2.10 | 0.63 |
| Oct | 1.42 | 2.68 | 1.25 |
| Nov | 2.41 | 2.70 | 0.29 |
| Dec | 1.48 | 2.27 | 0.80 |
| ⌀ Month | 1.66 | 2.21 | 0.55 |
Snow (mm)
| Month | ⌀ 1940 - 1950 | ⌀ 2013 - 2023 | +/- |
|---|---|---|---|
| Jan | 0.42 | 0.34 | -0.08 |
| Feb | 0.31 | 0.20 | -0.11 |
| Mar | 0.05 | 0.13 | 0.08 |
| Apr | 0.02 | 0.05 | 0.03 |
| May | 0.00 | 0.00 | 0.00 |
| Jun | 0.00 | 0.00 | 0.00 |
| Jul | 0.00 | 0.00 | 0.00 |
| Aug | 0.00 | 0.00 | 0.00 |
| Sep | 0.00 | 0.00 | 0.00 |
| Oct | 0.01 | 0.00 | -0.00 |
| Nov | 0.07 | 0.10 | 0.03 |
| Dec | 0.28 | 0.24 | -0.05 |
| ⌀ Month | 0.10 | 0.09 | -0.01 |