Climate Change Chart of Honiara, Solomon Islands
Comprehensive Climate Change Chart of Honiara, Solomon Islands: Monthly Averages and Impact Trends
Explore the changing climate in Honiara, Solomon Islands with insightful data comparisons from 1940-1950 to 2013-2024.
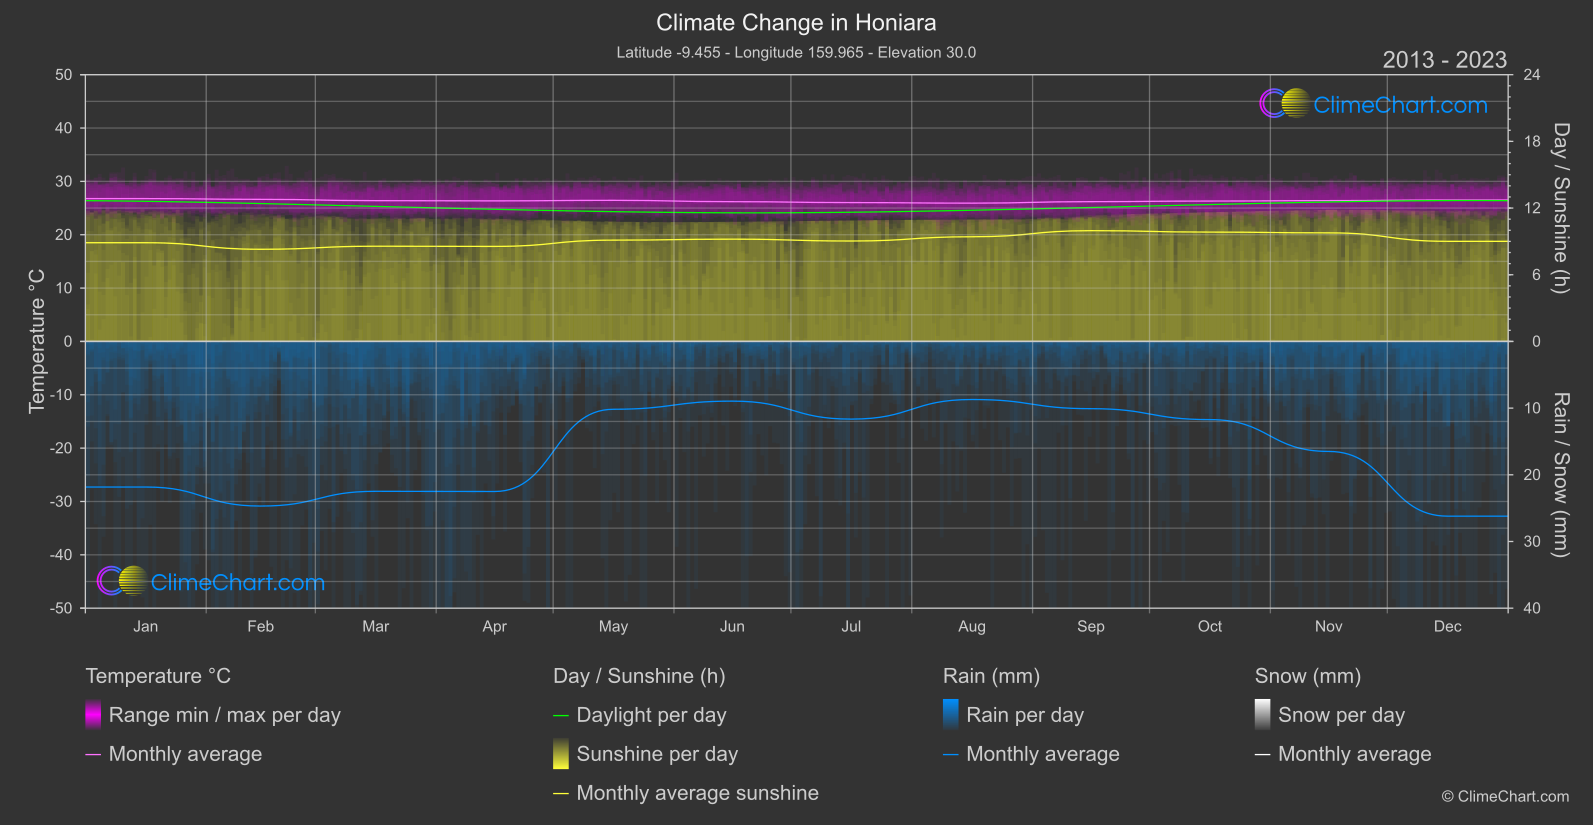
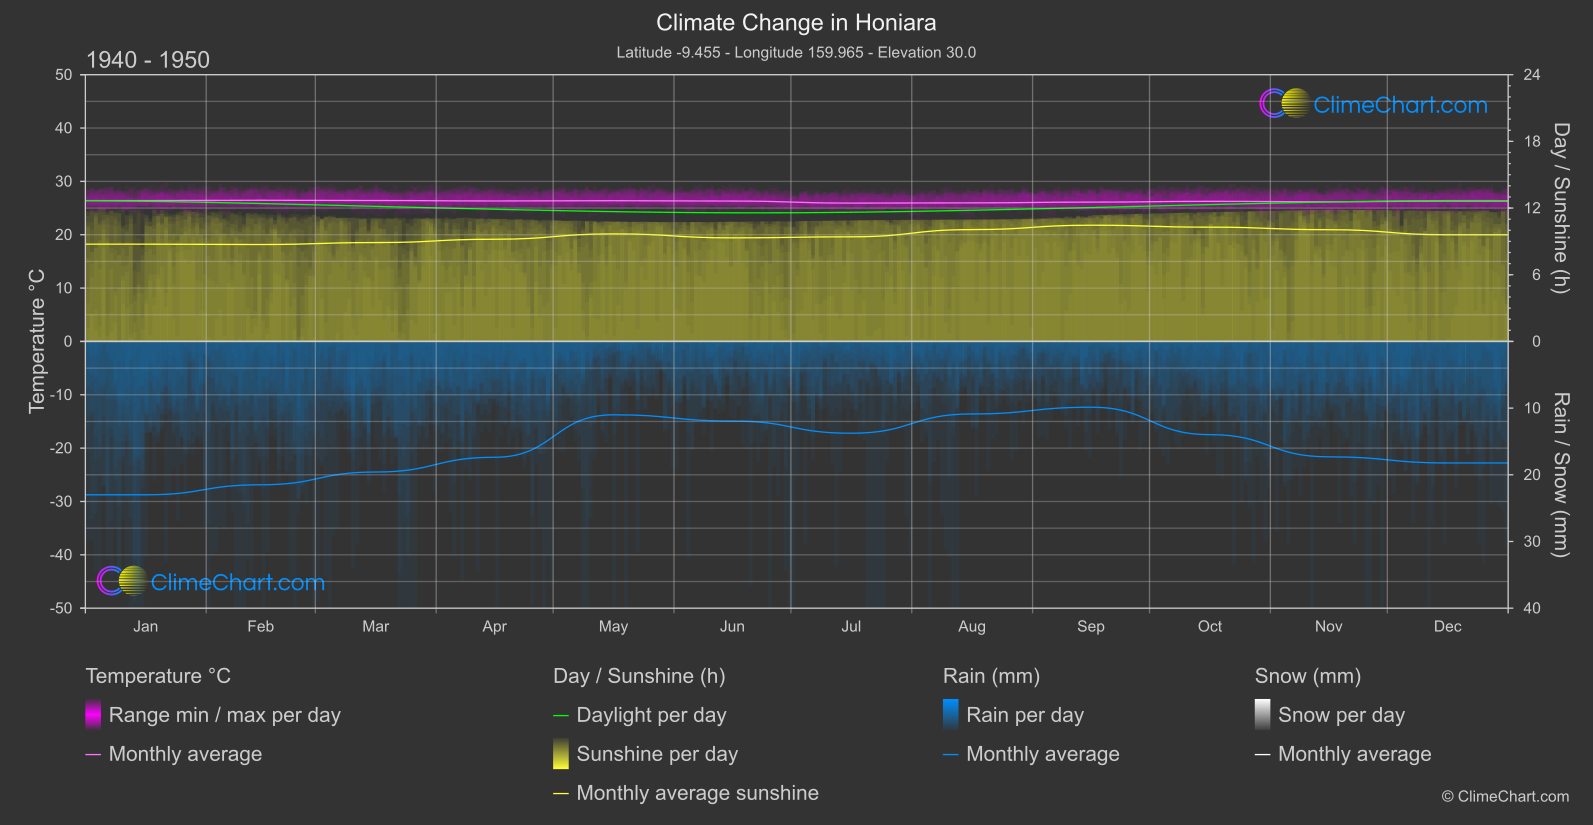
Honiara, the capital of the Solomon Islands, experiences notable changes in temperature, rainfall, and sunshine duration. In terms of temperature, the month with the highest change is December, with a temperature increase of 0.223°C from 1940-1950 to 2013-2024. Conversely, April sees a minimal temperature change of 0.017°C. Rainfall patterns also vary, with March experiencing a significant increase of 1.446mm, while May sees a decrease of 0.415mm. Sunshine duration shows fluctuations as well, with November having the highest decrease of -0.285 hours compared to February with a decrease of -0.428 hours.
Climate Change Data Overview for Honiara, Solomon Islands
Explore the comprehensive climate change data for Honiara, Solomon Islands. This detailed table provides valuable insights into temperature variations, precipitation levels, and seasonal changes influenced by climate change, helping you understand the unique weather patterns of this region.
Temperature °C
| Month | ⌀ 1940 - 1950 | ⌀ 2013 - 2023 | +/- |
|---|---|---|---|
| Jan | 26.40 | 26.77 | 0.37 |
| Feb | 26.46 | 26.63 | 0.17 |
| Mar | 26.41 | 26.39 | -0.02 |
| Apr | 26.33 | 26.35 | 0.02 |
| May | 26.38 | 26.45 | 0.07 |
| Jun | 26.31 | 26.20 | -0.12 |
| Jul | 25.93 | 26.02 | 0.09 |
| Aug | 25.97 | 25.92 | -0.05 |
| Sep | 26.12 | 26.20 | 0.08 |
| Oct | 26.26 | 26.31 | 0.05 |
| Nov | 26.18 | 26.40 | 0.22 |
| Dec | 26.30 | 26.52 | 0.22 |
| ⌀ Month | 26.25 | 26.35 | 0.09 |
Sunshine (h)
| Month | ⌀ 1940 - 1950 | ⌀ 2013 - 2023 | +/- |
|---|---|---|---|
| Jan | 8.75 | 8.88 | 0.13 |
| Feb | 8.72 | 8.29 | -0.43 |
| Mar | 8.89 | 8.57 | -0.33 |
| Apr | 9.19 | 8.55 | -0.64 |
| May | 9.67 | 9.11 | -0.56 |
| Jun | 9.32 | 9.20 | -0.12 |
| Jul | 9.41 | 9.04 | -0.38 |
| Aug | 10.06 | 9.42 | -0.64 |
| Sep | 10.46 | 9.97 | -0.49 |
| Oct | 10.28 | 9.84 | -0.44 |
| Nov | 10.05 | 9.77 | -0.29 |
| Dec | 9.60 | 9.01 | -0.59 |
| ⌀ Month | 9.53 | 9.14 | -0.40 |
Rain (mm)
| Month | ⌀ 1940 - 1950 | ⌀ 2013 - 2023 | +/- |
|---|---|---|---|
| Jan | 11.50 | 10.92 | -0.58 |
| Feb | 10.75 | 12.34 | 1.59 |
| Mar | 9.79 | 11.24 | 1.45 |
| Apr | 8.68 | 11.25 | 2.57 |
| May | 5.50 | 5.09 | -0.41 |
| Jun | 5.97 | 4.48 | -1.49 |
| Jul | 6.88 | 5.82 | -1.06 |
| Aug | 5.44 | 4.35 | -1.08 |
| Sep | 4.93 | 5.04 | 0.11 |
| Oct | 6.99 | 5.86 | -1.13 |
| Nov | 8.65 | 8.25 | -0.40 |
| Dec | 9.11 | 13.10 | 3.99 |
| ⌀ Month | 7.85 | 8.14 | 0.30 |
Snow (mm)
| Month | ⌀ 1940 - 1950 | ⌀ 2013 - 2023 | +/- |
|---|---|---|---|
| Jan | 0.00 | 0.00 | 0.00 |
| Feb | 0.00 | 0.00 | 0.00 |
| Mar | 0.00 | 0.00 | 0.00 |
| Apr | 0.00 | 0.00 | 0.00 |
| May | 0.00 | 0.00 | 0.00 |
| Jun | 0.00 | 0.00 | 0.00 |
| Jul | 0.00 | 0.00 | 0.00 |
| Aug | 0.00 | 0.00 | 0.00 |
| Sep | 0.00 | 0.00 | 0.00 |
| Oct | 0.00 | 0.00 | 0.00 |
| Nov | 0.00 | 0.00 | 0.00 |
| Dec | 0.00 | 0.00 | 0.00 |
| ⌀ Month | 0.00 | 0.00 | 0.00 |