Climate Change Chart of Fiji, Fiji
Comprehensive Climate Change Chart of Fiji, Fiji: Monthly Averages and Impact Trends
Exploring the changing climate in Fiji, showcasing temperature, rainfall, and sunshine duration trends.
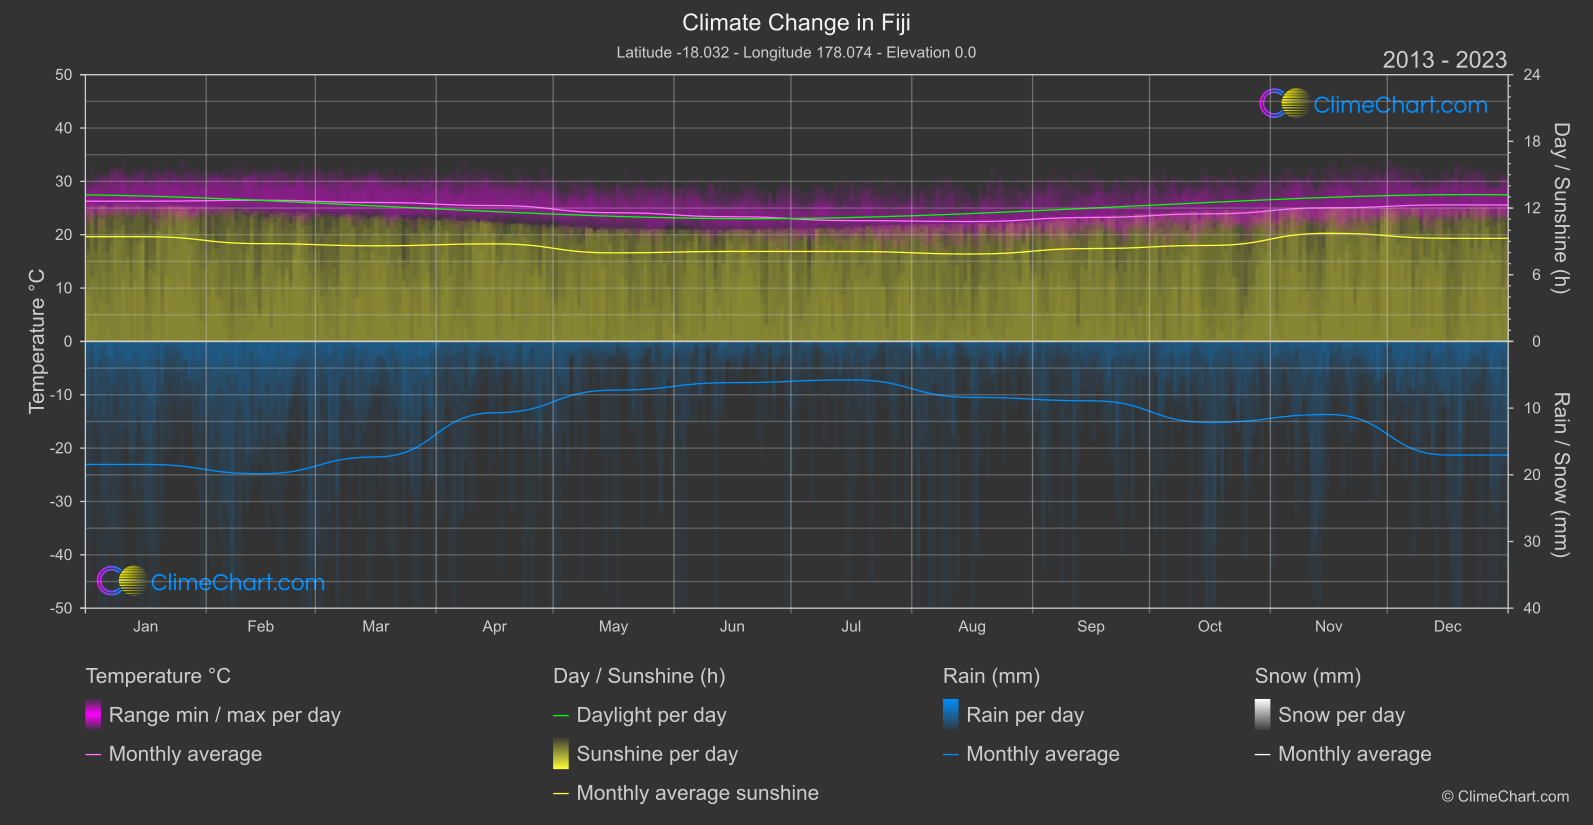
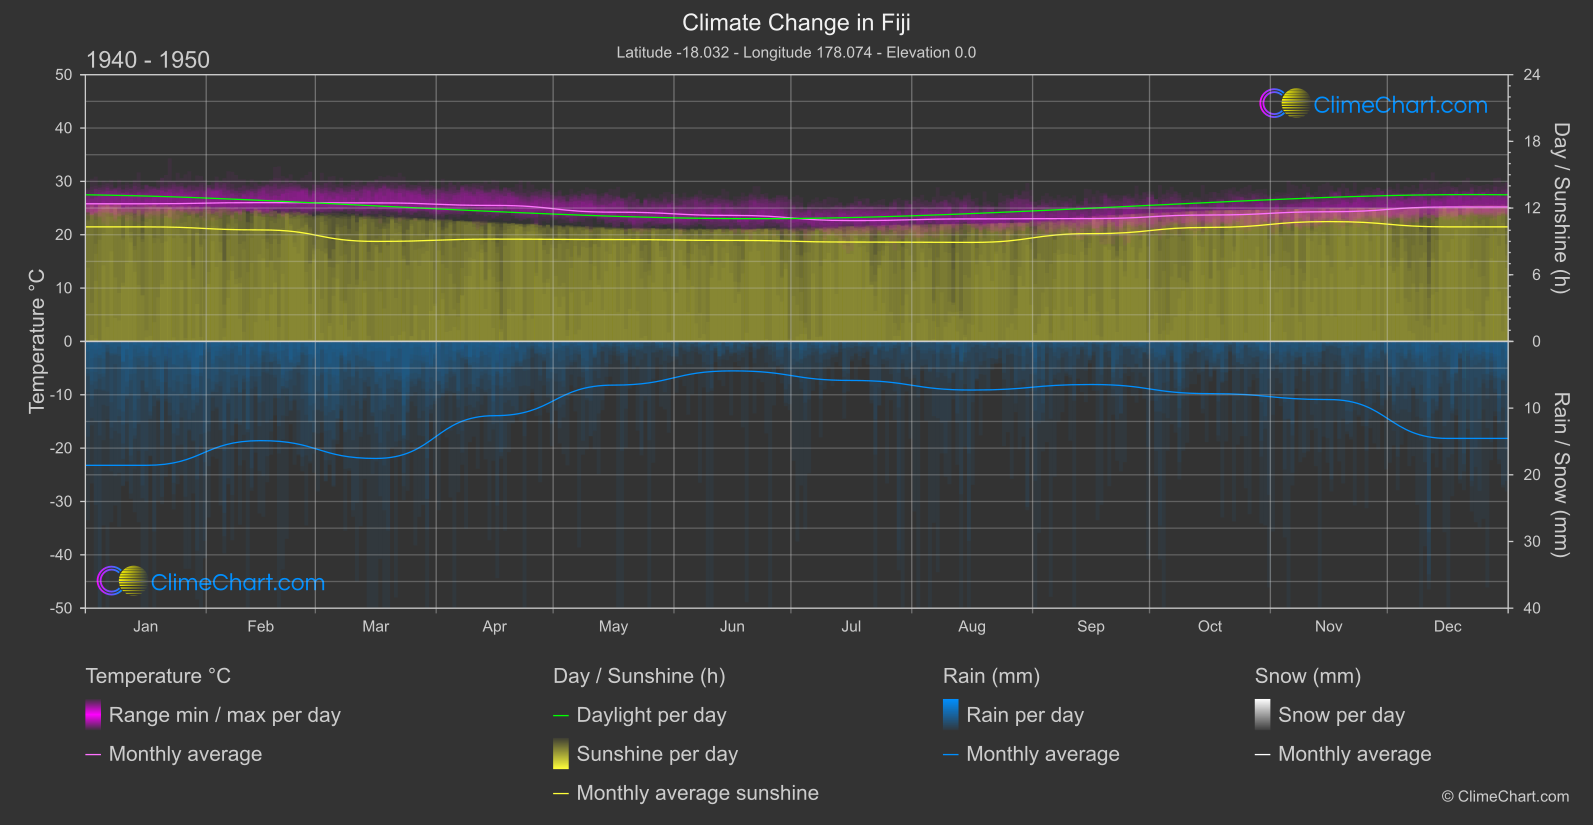
Fiji's climate is experiencing notable changes in temperature, rainfall, and sunshine duration. From the data analysis, it is evident that temperatures have generally increased over the years, with the month of November showing the highest temperature change. Rainfall patterns have also shifted, with February experiencing the most significant increase in rainfall. Additionally, sunshine duration has decreased across the months, with October showing the largest decrease. These trends indicate the impact of climate change on Fiji's weather patterns.
Climate Change Data Overview for Fiji, Fiji
Explore the comprehensive climate change data for Fiji, Fiji. This detailed table provides valuable insights into temperature variations, precipitation levels, and seasonal changes influenced by climate change, helping you understand the unique weather patterns of this region.
Temperature °C
| Month | ⌀ 1940 - 1950 | ⌀ 2013 - 2023 | +/- |
|---|---|---|---|
| Jan | 25.80 | 26.28 | 0.48 |
| Feb | 26.02 | 26.46 | 0.44 |
| Mar | 25.97 | 26.04 | 0.08 |
| Apr | 25.49 | 25.47 | -0.02 |
| May | 24.23 | 24.12 | -0.11 |
| Jun | 23.62 | 23.37 | -0.25 |
| Jul | 22.65 | 22.65 | -0.00 |
| Aug | 22.97 | 22.47 | -0.50 |
| Sep | 23.03 | 23.24 | 0.20 |
| Oct | 23.70 | 23.92 | 0.22 |
| Nov | 24.31 | 25.05 | 0.74 |
| Dec | 25.20 | 25.59 | 0.39 |
| ⌀ Month | 24.42 | 24.56 | 0.14 |
Sunshine (h)
| Month | ⌀ 1940 - 1950 | ⌀ 2013 - 2023 | +/- |
|---|---|---|---|
| Jan | 10.31 | 9.42 | -0.89 |
| Feb | 10.03 | 8.80 | -1.23 |
| Mar | 9.00 | 8.60 | -0.40 |
| Apr | 9.20 | 8.78 | -0.43 |
| May | 9.17 | 7.97 | -1.20 |
| Jun | 9.09 | 8.10 | -0.99 |
| Jul | 8.94 | 8.09 | -0.85 |
| Aug | 8.91 | 7.87 | -1.04 |
| Sep | 9.70 | 8.36 | -1.34 |
| Oct | 10.26 | 8.64 | -1.62 |
| Nov | 10.78 | 9.73 | -1.05 |
| Dec | 10.31 | 9.28 | -1.03 |
| ⌀ Month | 9.64 | 8.64 | -1.01 |
Rain (mm)
| Month | ⌀ 1940 - 1950 | ⌀ 2013 - 2023 | +/- |
|---|---|---|---|
| Jan | 9.29 | 9.22 | -0.06 |
| Feb | 7.44 | 9.92 | 2.48 |
| Mar | 8.77 | 8.66 | -0.11 |
| Apr | 5.57 | 5.35 | -0.22 |
| May | 3.28 | 3.65 | 0.38 |
| Jun | 2.21 | 3.09 | 0.88 |
| Jul | 2.93 | 2.88 | -0.04 |
| Aug | 3.64 | 4.20 | 0.55 |
| Sep | 3.23 | 4.45 | 1.22 |
| Oct | 3.91 | 6.07 | 2.16 |
| Nov | 4.36 | 5.48 | 1.12 |
| Dec | 7.27 | 8.52 | 1.25 |
| ⌀ Month | 5.16 | 5.96 | 0.80 |
Snow (mm)
| Month | ⌀ 1940 - 1950 | ⌀ 2013 - 2023 | +/- |
|---|---|---|---|
| Jan | 0.00 | 0.00 | 0.00 |
| Feb | 0.00 | 0.00 | 0.00 |
| Mar | 0.00 | 0.00 | 0.00 |
| Apr | 0.00 | 0.00 | 0.00 |
| May | 0.00 | 0.00 | 0.00 |
| Jun | 0.00 | 0.00 | 0.00 |
| Jul | 0.00 | 0.00 | 0.00 |
| Aug | 0.00 | 0.00 | 0.00 |
| Sep | 0.00 | 0.00 | 0.00 |
| Oct | 0.00 | 0.00 | 0.00 |
| Nov | 0.00 | 0.00 | 0.00 |
| Dec | 0.00 | 0.00 | 0.00 |
| ⌀ Month | 0.00 | 0.00 | 0.00 |