Climate Change Chart of Faroe Islands, Denmark
Comprehensive Climate Change Chart of Faroe Islands, Denmark: Monthly Averages and Impact Trends
Exploring the climate changes in Faroe Islands, Denmark reveals intriguing insights into temperature, rainfall, snowfall, and sunshine duration over the years.
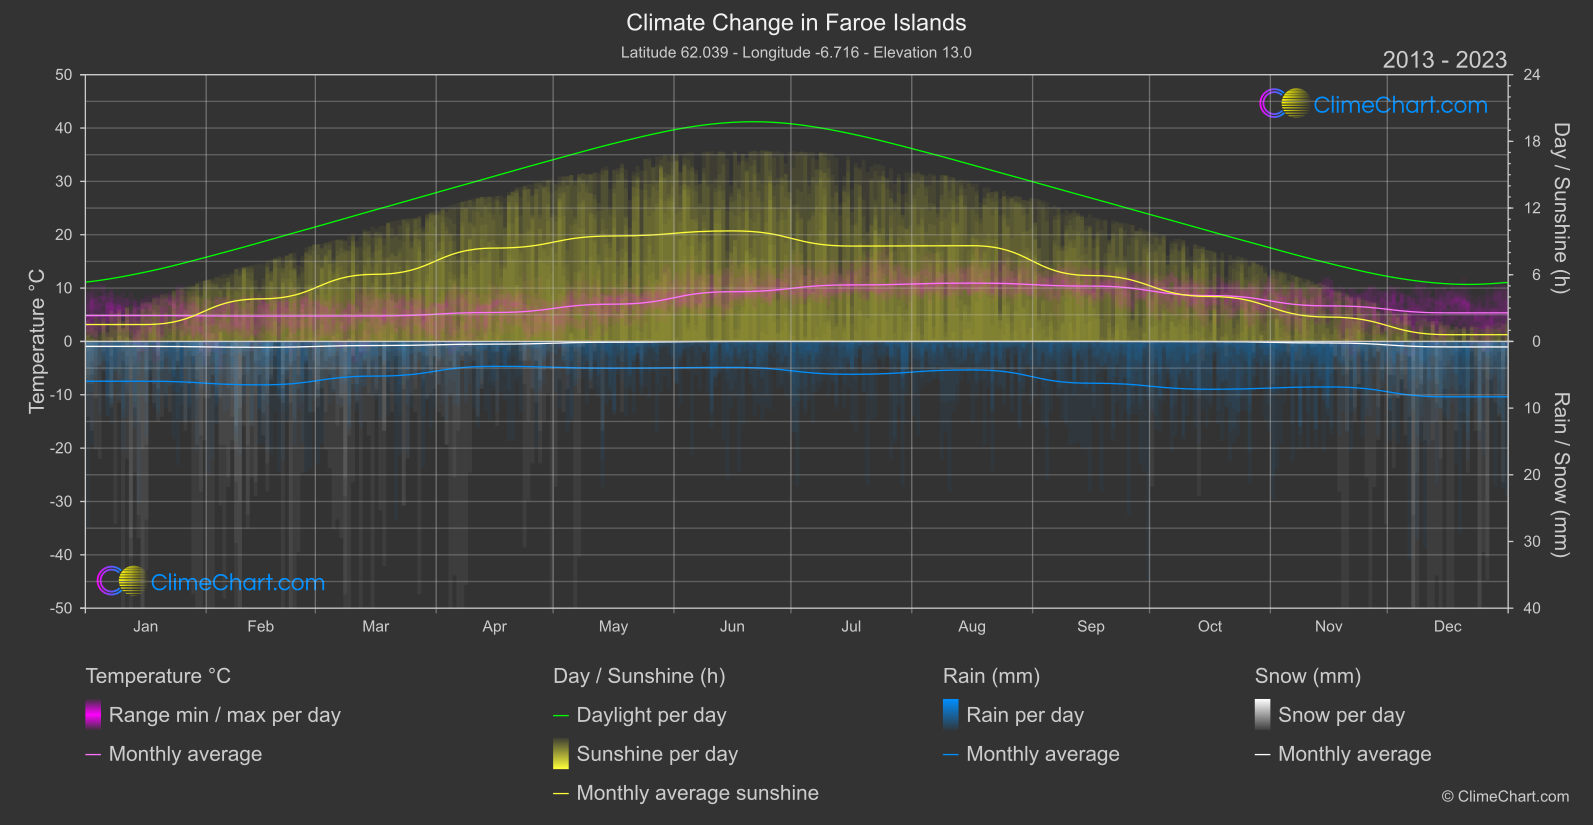
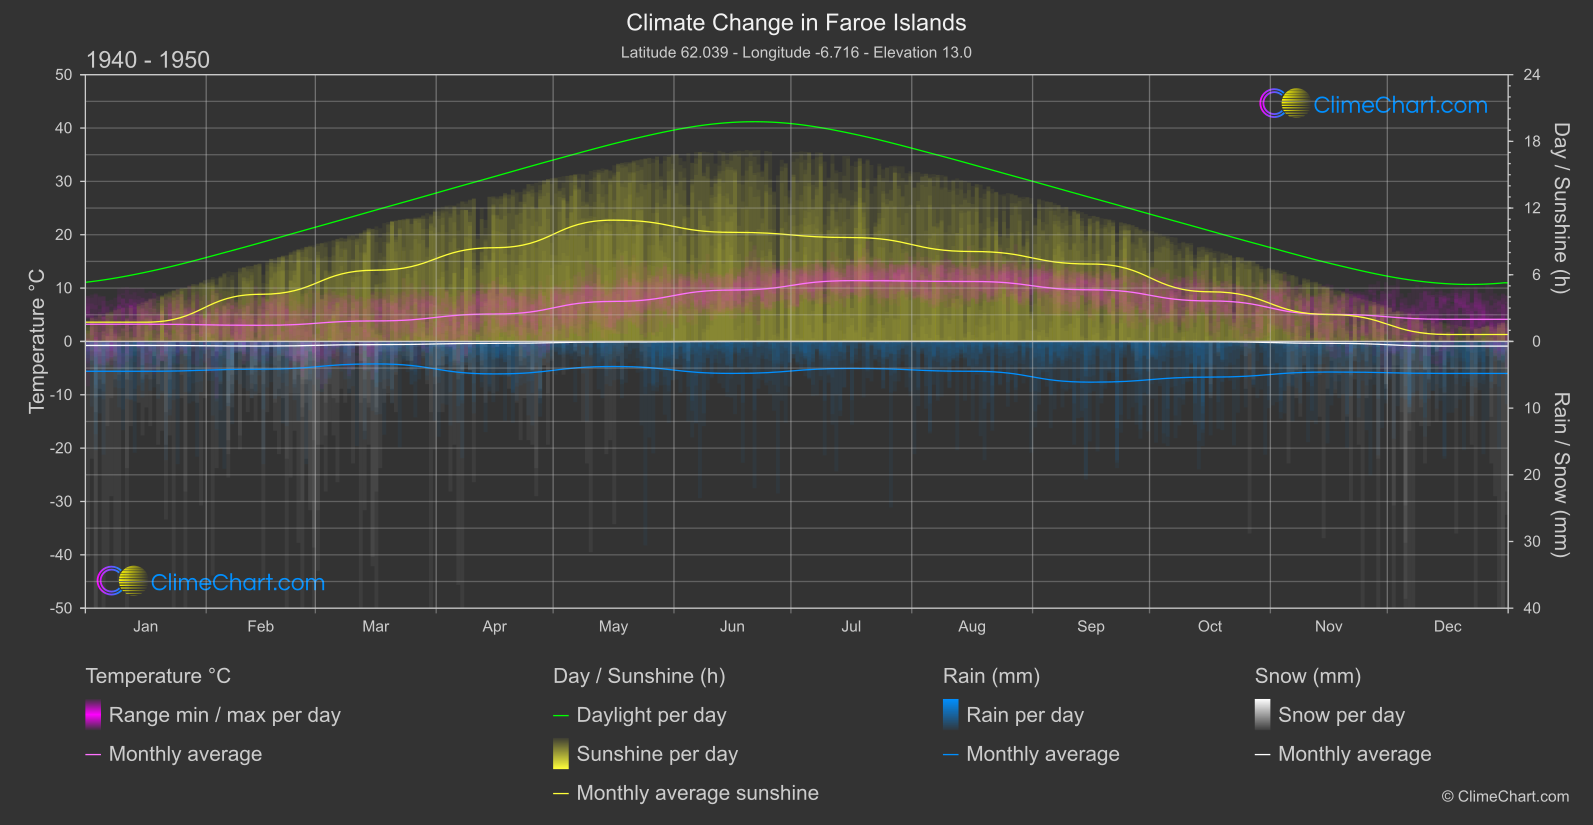
Faroe Islands, Denmark, experience notable changes in climate variables such as temperature, rainfall, snowfall, and sunshine duration. Analyzing data from 1940 to 1950 compared to 2013 to 2024 reveals fluctuations in these parameters. For instance, the month of November shows a significant temperature increase of 1.59°C and a notable rise in rainfall of 1.12mm. Conversely, sunshine duration decreased by 0.23 hours in November.
Climate Change Data Overview for Faroe Islands, Denmark
Explore the comprehensive climate change data for Faroe Islands, Denmark. This detailed table provides valuable insights into temperature variations, precipitation levels, and seasonal changes influenced by climate change, helping you understand the unique weather patterns of this region.
Temperature °C
| Month | ⌀ 1940 - 1950 | ⌀ 2013 - 2023 | +/- |
|---|---|---|---|
| Jan | 3.22 | 4.84 | 1.62 |
| Feb | 3.02 | 4.75 | 1.72 |
| Mar | 3.85 | 4.78 | 0.94 |
| Apr | 5.14 | 5.43 | 0.29 |
| May | 7.50 | 6.99 | -0.52 |
| Jun | 9.63 | 9.32 | -0.31 |
| Jul | 11.39 | 10.59 | -0.80 |
| Aug | 11.24 | 10.93 | -0.31 |
| Sep | 9.68 | 10.37 | 0.69 |
| Oct | 7.59 | 8.60 | 1.00 |
| Nov | 5.07 | 6.66 | 1.59 |
| Dec | 4.15 | 5.36 | 1.21 |
| ⌀ Month | 6.79 | 7.38 | 0.59 |
Sunshine (h)
| Month | ⌀ 1940 - 1950 | ⌀ 2013 - 2023 | +/- |
|---|---|---|---|
| Jan | 1.73 | 1.52 | -0.21 |
| Feb | 4.24 | 3.83 | -0.41 |
| Mar | 6.41 | 6.04 | -0.37 |
| Apr | 8.43 | 8.40 | -0.04 |
| May | 10.91 | 9.49 | -1.42 |
| Jun | 9.81 | 9.95 | 0.13 |
| Jul | 9.35 | 8.58 | -0.77 |
| Aug | 8.09 | 8.61 | 0.52 |
| Sep | 6.96 | 5.93 | -1.03 |
| Oct | 4.47 | 4.04 | -0.43 |
| Nov | 2.42 | 2.19 | -0.23 |
| Dec | 0.63 | 0.60 | -0.02 |
| ⌀ Month | 6.12 | 5.77 | -0.36 |
Rain (mm)
| Month | ⌀ 1940 - 1950 | ⌀ 2013 - 2023 | +/- |
|---|---|---|---|
| Jan | 2.24 | 2.98 | 0.75 |
| Feb | 2.08 | 3.26 | 1.17 |
| Mar | 1.69 | 2.60 | 0.91 |
| Apr | 2.44 | 1.87 | -0.57 |
| May | 1.88 | 2.00 | 0.12 |
| Jun | 2.40 | 1.95 | -0.45 |
| Jul | 2.02 | 2.46 | 0.44 |
| Aug | 2.24 | 2.13 | -0.10 |
| Sep | 3.05 | 3.13 | 0.08 |
| Oct | 2.67 | 3.58 | 0.91 |
| Nov | 2.29 | 3.41 | 1.12 |
| Dec | 2.40 | 4.15 | 1.75 |
| ⌀ Month | 2.28 | 2.79 | 0.51 |
Snow (mm)
| Month | ⌀ 1940 - 1950 | ⌀ 2013 - 2023 | +/- |
|---|---|---|---|
| Jan | 0.30 | 0.37 | 0.07 |
| Feb | 0.35 | 0.44 | 0.09 |
| Mar | 0.24 | 0.31 | 0.07 |
| Apr | 0.14 | 0.20 | 0.06 |
| May | 0.04 | 0.06 | 0.02 |
| Jun | 0.00 | 0.00 | -0.00 |
| Jul | 0.00 | 0.00 | 0.00 |
| Aug | 0.00 | 0.00 | 0.00 |
| Sep | 0.00 | 0.00 | -0.00 |
| Oct | 0.02 | 0.01 | -0.00 |
| Nov | 0.14 | 0.12 | -0.03 |
| Dec | 0.35 | 0.41 | 0.06 |
| ⌀ Month | 0.13 | 0.16 | 0.03 |