Climate Change Chart of Belmopan, Belize
Comprehensive Climate Change Chart of Belmopan, Belize: Monthly Averages and Impact Trends
Explore the changing climate in Belmopan, Belize with insightful data analysis. Discover how temperatures, rainfall, and sunshine duration have evolved over the years.
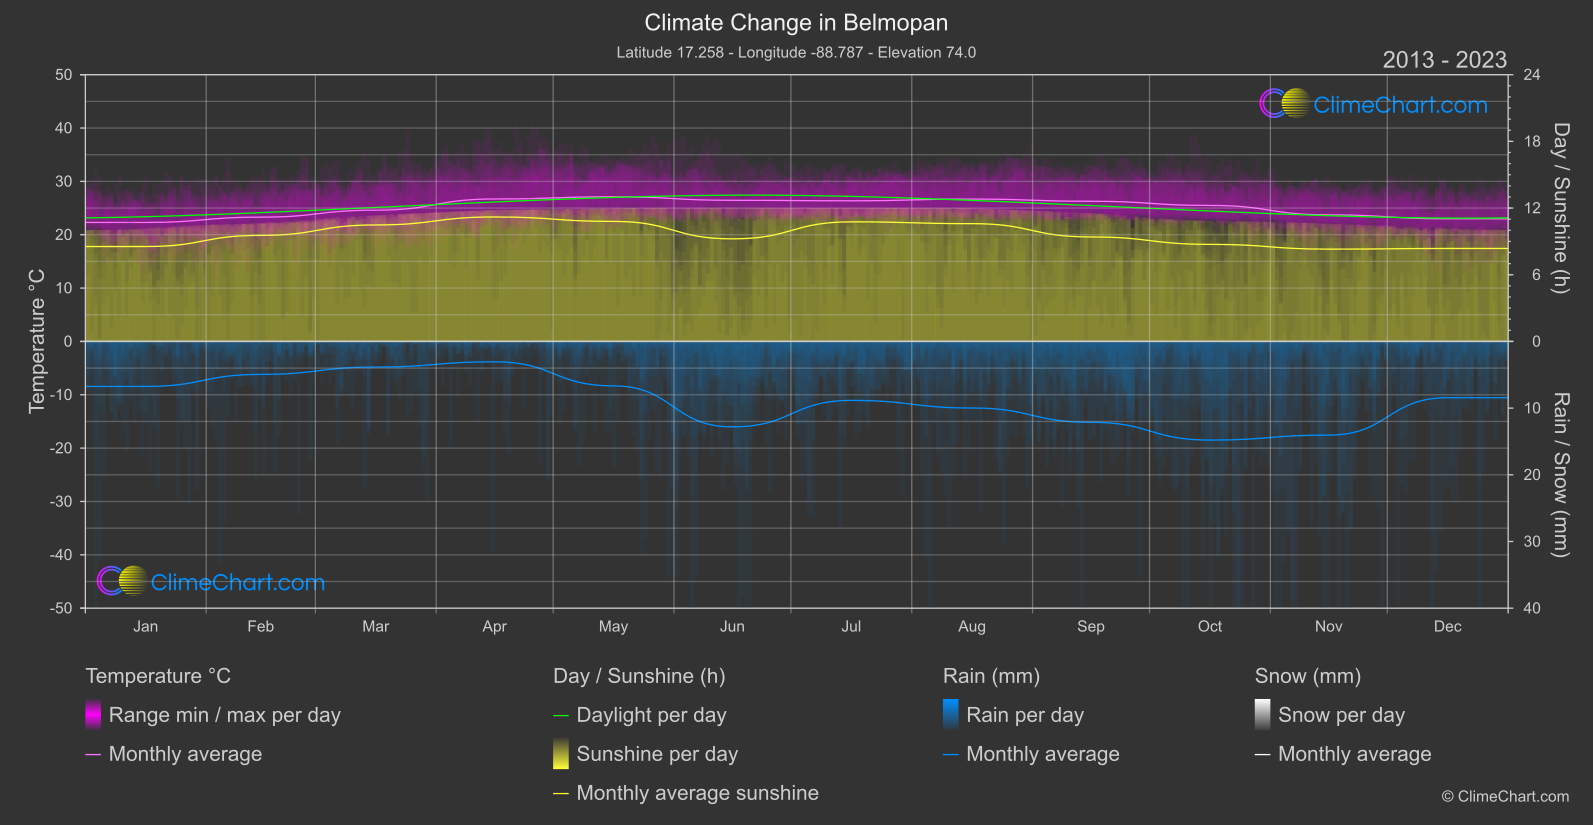
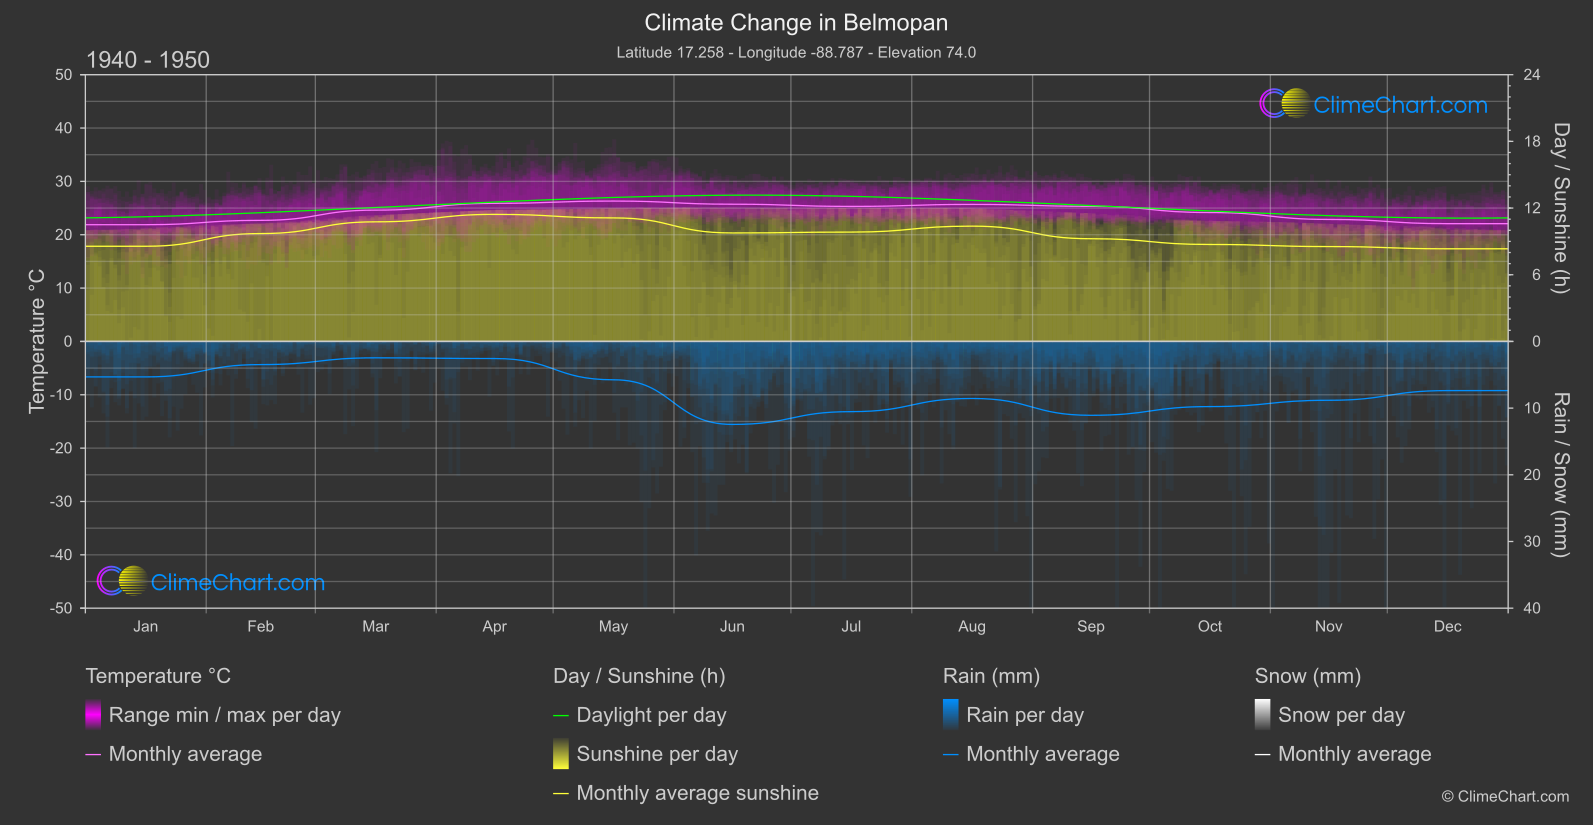
Belmopan, the capital of Belize, experiences notable changes in climate patterns. From the 1940s to the present day, the data shows a consistent increase in temperatures across most months. Notably, October stands out with a significant temperature rise of 1.33°C. Rainfall patterns have also shifted, with October and November experiencing the most substantial increases. Sunshine duration has seen fluctuations over the years, with July exhibiting a notable increase in sunshine hours. These trends underscore the impact of climate change on Belmopan's weather.
Climate Change Data Overview for Belmopan, Belize
Explore the comprehensive climate change data for Belmopan, Belize. This detailed table provides valuable insights into temperature variations, precipitation levels, and seasonal changes influenced by climate change, helping you understand the unique weather patterns of this region.
Temperature °C
| Month | ⌀ 1940 - 1950 | ⌀ 2013 - 2023 | +/- |
|---|---|---|---|
| Jan | 21.88 | 22.30 | 0.42 |
| Feb | 22.70 | 23.30 | 0.60 |
| Mar | 24.61 | 24.60 | -0.01 |
| Apr | 25.89 | 26.70 | 0.82 |
| May | 26.31 | 27.11 | 0.80 |
| Jun | 25.72 | 26.45 | 0.73 |
| Jul | 25.31 | 26.36 | 1.05 |
| Aug | 25.69 | 26.68 | 1.00 |
| Sep | 25.33 | 26.27 | 0.94 |
| Oct | 24.16 | 25.49 | 1.33 |
| Nov | 22.87 | 23.72 | 0.85 |
| Dec | 22.07 | 22.98 | 0.90 |
| ⌀ Month | 24.38 | 25.16 | 0.79 |
Sunshine (h)
| Month | ⌀ 1940 - 1950 | ⌀ 2013 - 2023 | +/- |
|---|---|---|---|
| Jan | 8.56 | 8.54 | -0.02 |
| Feb | 9.71 | 9.54 | -0.16 |
| Mar | 10.76 | 10.48 | -0.28 |
| Apr | 11.43 | 11.20 | -0.23 |
| May | 11.11 | 10.80 | -0.31 |
| Jun | 9.76 | 9.23 | -0.53 |
| Jul | 9.84 | 10.76 | 0.92 |
| Aug | 10.37 | 10.60 | 0.22 |
| Sep | 9.24 | 9.40 | 0.16 |
| Oct | 8.72 | 8.73 | 0.01 |
| Nov | 8.54 | 8.30 | -0.23 |
| Dec | 8.33 | 8.37 | 0.03 |
| ⌀ Month | 9.70 | 9.66 | -0.04 |
Rain (mm)
| Month | ⌀ 1940 - 1950 | ⌀ 2013 - 2023 | +/- |
|---|---|---|---|
| Jan | 2.66 | 3.37 | 0.71 |
| Feb | 1.74 | 2.47 | 0.74 |
| Mar | 1.23 | 1.92 | 0.69 |
| Apr | 1.28 | 1.53 | 0.24 |
| May | 2.88 | 3.33 | 0.46 |
| Jun | 6.22 | 6.41 | 0.18 |
| Jul | 5.26 | 4.42 | -0.84 |
| Aug | 4.28 | 4.99 | 0.71 |
| Sep | 5.54 | 6.06 | 0.52 |
| Oct | 4.89 | 7.40 | 2.51 |
| Nov | 4.41 | 7.02 | 2.61 |
| Dec | 3.69 | 4.22 | 0.53 |
| ⌀ Month | 3.67 | 4.43 | 0.76 |
Snow (mm)
| Month | ⌀ 1940 - 1950 | ⌀ 2013 - 2023 | +/- |
|---|---|---|---|
| Jan | 0.00 | 0.00 | 0.00 |
| Feb | 0.00 | 0.00 | 0.00 |
| Mar | 0.00 | 0.00 | 0.00 |
| Apr | 0.00 | 0.00 | 0.00 |
| May | 0.00 | 0.00 | 0.00 |
| Jun | 0.00 | 0.00 | 0.00 |
| Jul | 0.00 | 0.00 | 0.00 |
| Aug | 0.00 | 0.00 | 0.00 |
| Sep | 0.00 | 0.00 | 0.00 |
| Oct | 0.00 | 0.00 | 0.00 |
| Nov | 0.00 | 0.00 | 0.00 |
| Dec | 0.00 | 0.00 | 0.00 |
| ⌀ Month | 0.00 | 0.00 | 0.00 |