Climate Change Chart of Andorra la Vella, Andorra
Comprehensive Climate Change Chart of Andorra la Vella, Andorra: Monthly Averages and Impact Trends
Explore the changing climate in Andorra la Vella, Andorra, with insights from temperature, rainfall, snowfall, and sunshine duration data. Discover how the climate has evolved from 1940 to 1950 compared to 2013 to 2024.
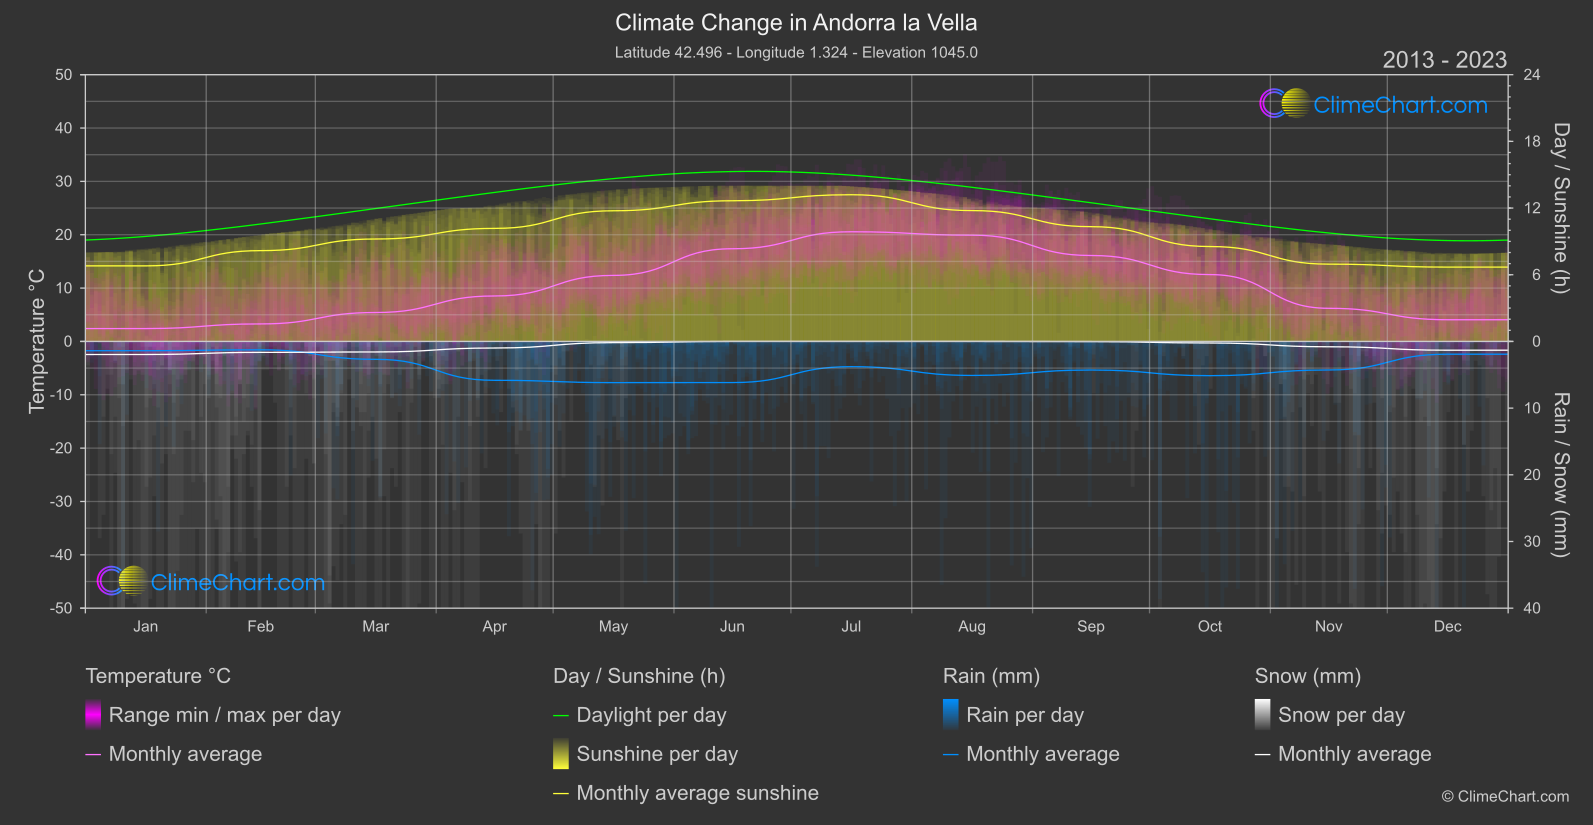
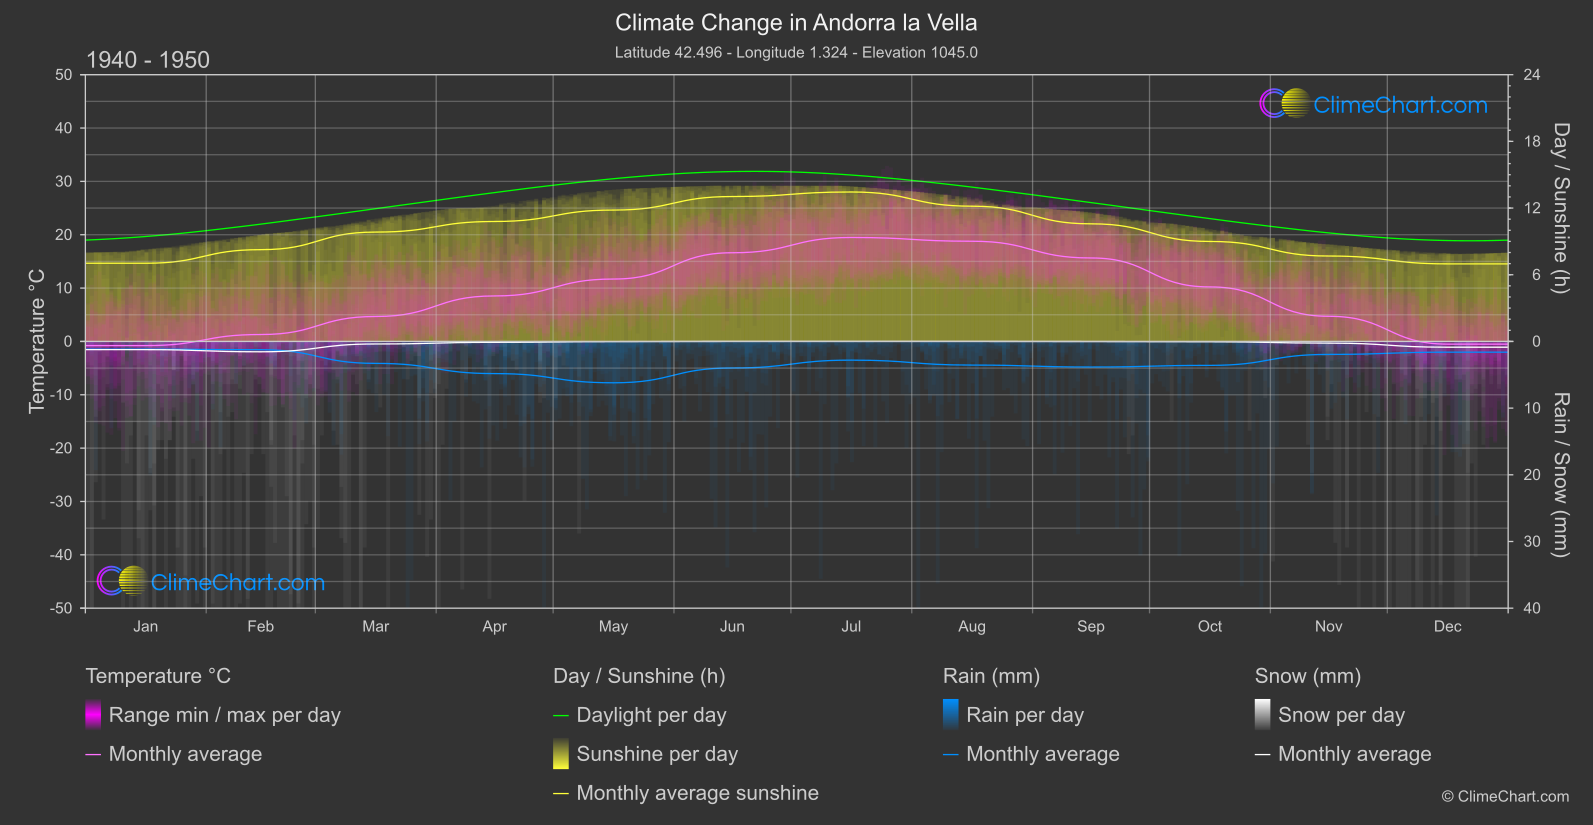
Andorra la Vella, the capital of Andorra, has experienced notable changes in its climate over the years. The data reveals interesting patterns, such as the shift in temperature averages and rainfall amounts. For instance, the month with the highest change in temperature is December, showing a significant increase from 1940 to 1950 to 2013 to 2024. On the other hand, the month with the most notable change in rainfall is November, indicating a considerable rise in precipitation levels. Understanding these climate variations is crucial in adapting to the evolving environmental conditions in Andorra la Vella.
Climate Change Data Overview for Andorra la Vella, Andorra
Explore the comprehensive climate change data for Andorra la Vella, Andorra. This detailed table provides valuable insights into temperature variations, precipitation levels, and seasonal changes influenced by climate change, helping you understand the unique weather patterns of this region.
Temperature °C
| Month | ⌀ 1940 - 1950 | ⌀ 2013 - 2023 | +/- |
|---|---|---|---|
| Jan | -0.78 | 2.41 | 3.20 |
| Feb | 1.29 | 3.28 | 1.99 |
| Mar | 4.67 | 5.42 | 0.75 |
| Apr | 8.53 | 8.52 | -0.01 |
| May | 11.69 | 12.38 | 0.68 |
| Jun | 16.62 | 17.37 | 0.75 |
| Jul | 19.49 | 20.56 | 1.07 |
| Aug | 18.78 | 19.92 | 1.14 |
| Sep | 15.65 | 16.11 | 0.46 |
| Oct | 10.22 | 12.53 | 2.31 |
| Nov | 4.71 | 6.21 | 1.50 |
| Dec | -0.50 | 4.07 | 4.57 |
| ⌀ Month | 9.20 | 10.73 | 1.53 |
Sunshine (h)
| Month | ⌀ 1940 - 1950 | ⌀ 2013 - 2023 | +/- |
|---|---|---|---|
| Jan | 7.03 | 6.80 | -0.24 |
| Feb | 8.26 | 8.17 | -0.09 |
| Mar | 9.84 | 9.22 | -0.62 |
| Apr | 10.79 | 10.17 | -0.62 |
| May | 11.82 | 11.76 | -0.06 |
| Jun | 13.04 | 12.66 | -0.38 |
| Jul | 13.45 | 13.20 | -0.25 |
| Aug | 12.17 | 11.77 | -0.39 |
| Sep | 10.58 | 10.33 | -0.25 |
| Oct | 9.00 | 8.54 | -0.46 |
| Nov | 7.68 | 6.95 | -0.73 |
| Dec | 6.98 | 6.69 | -0.29 |
| ⌀ Month | 10.05 | 9.69 | -0.37 |
Rain (mm)
| Month | ⌀ 1940 - 1950 | ⌀ 2013 - 2023 | +/- |
|---|---|---|---|
| Jan | 0.58 | 0.70 | 0.11 |
| Feb | 0.62 | 0.63 | 0.01 |
| Mar | 1.65 | 1.34 | -0.30 |
| Apr | 2.41 | 2.92 | 0.50 |
| May | 3.10 | 3.09 | -0.01 |
| Jun | 1.99 | 3.08 | 1.09 |
| Jul | 1.40 | 1.89 | 0.49 |
| Aug | 1.77 | 2.55 | 0.78 |
| Sep | 1.92 | 2.14 | 0.22 |
| Oct | 1.80 | 2.57 | 0.77 |
| Nov | 0.97 | 2.14 | 1.17 |
| Dec | 0.80 | 0.96 | 0.15 |
| ⌀ Month | 1.59 | 2.00 | 0.42 |
Snow (mm)
| Month | ⌀ 1940 - 1950 | ⌀ 2013 - 2023 | +/- |
|---|---|---|---|
| Jan | 0.62 | 0.98 | 0.36 |
| Feb | 0.78 | 0.82 | 0.04 |
| Mar | 0.19 | 0.79 | 0.60 |
| Apr | 0.07 | 0.49 | 0.43 |
| May | 0.01 | 0.09 | 0.08 |
| Jun | 0.00 | 0.00 | 0.00 |
| Jul | 0.00 | 0.00 | 0.00 |
| Aug | 0.00 | 0.00 | 0.00 |
| Sep | 0.01 | 0.01 | 0.00 |
| Oct | 0.02 | 0.12 | 0.09 |
| Nov | 0.13 | 0.40 | 0.27 |
| Dec | 0.43 | 0.66 | 0.23 |
| ⌀ Month | 0.19 | 0.36 | 0.18 |