Climate Change Chart of New Caledonia, New Caledonia
Comprehensive Climate Change Chart of New Caledonia, New Caledonia: Monthly Averages and Impact Trends
Explore the changing climate patterns in New Caledonia with insightful data analysis. Discover the impact of temperature, rainfall, and sunshine duration over the years.
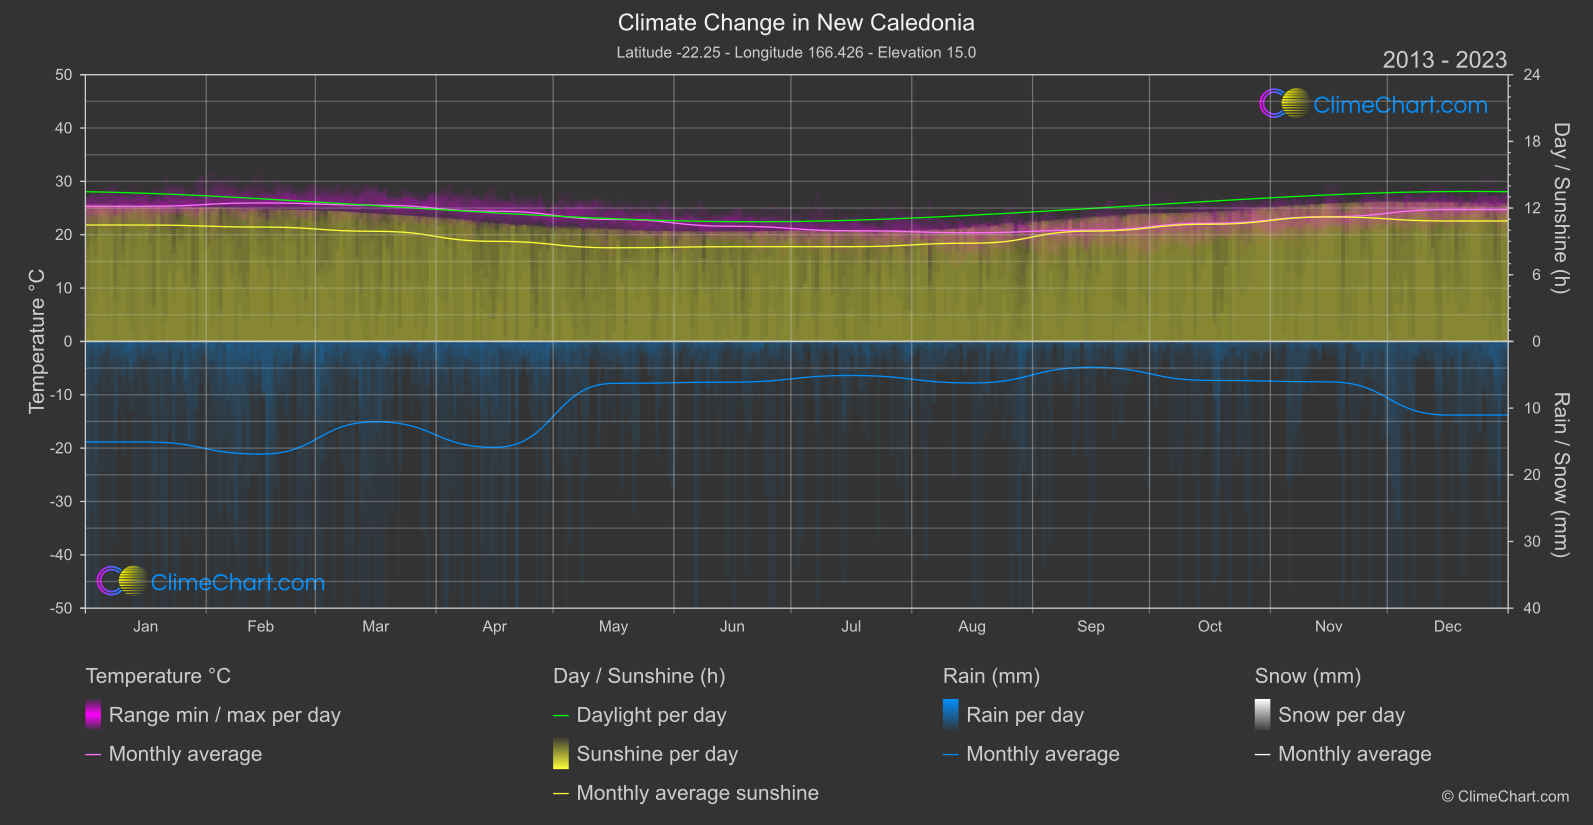
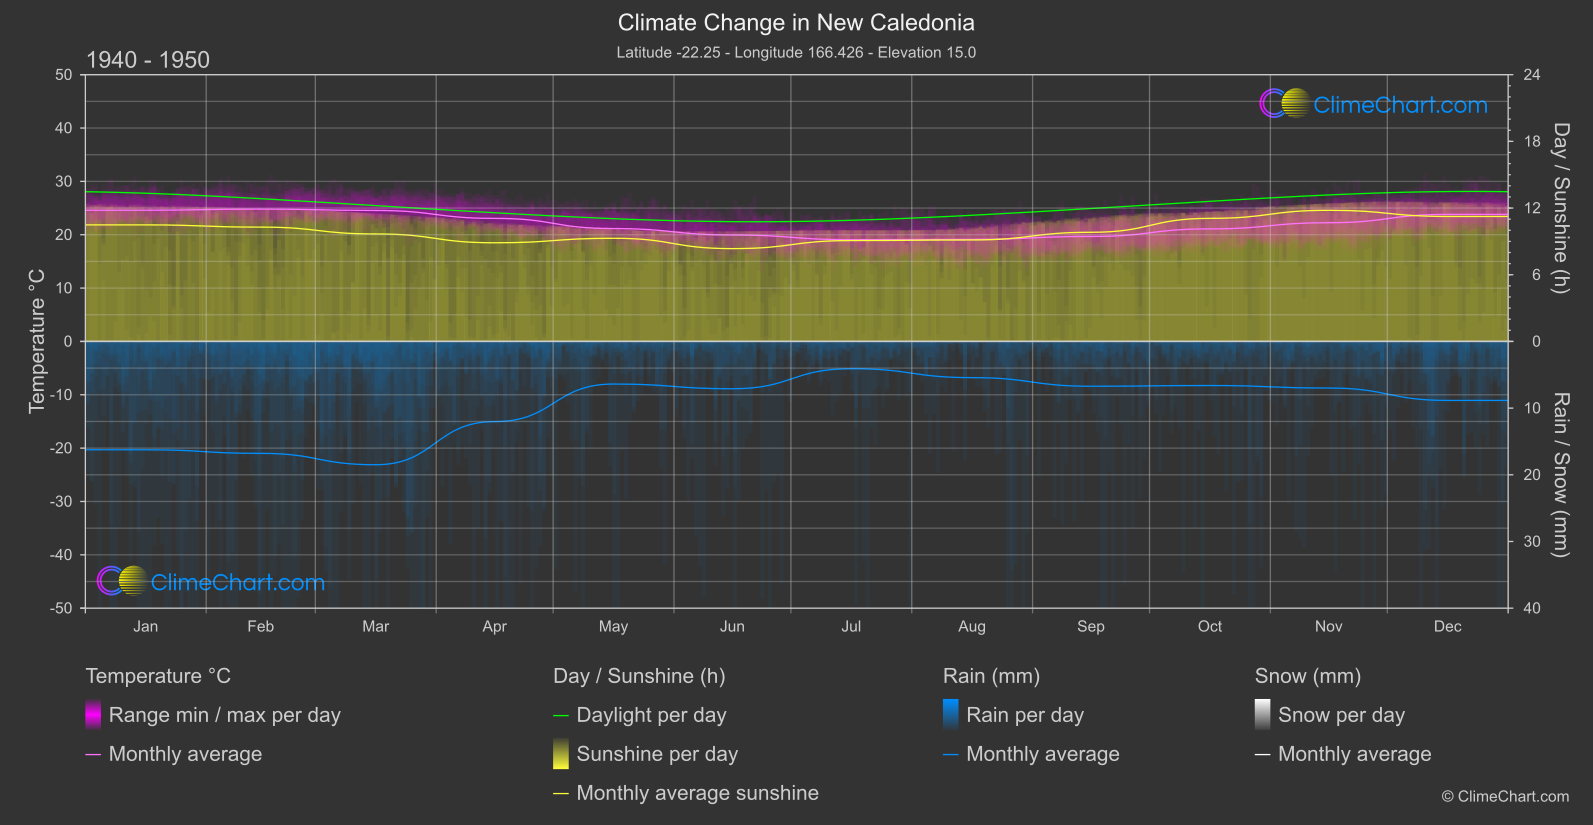
New Caledonia, a beautiful archipelago in the Pacific, experiences notable changes in climate parameters. From the 1940s to the 1950s compared to recent years (2013 - 2024), there has been a consistent increase in average temperatures. The month of May shows the highest temperature change of approximately 1.72°C, indicating a significant warming trend. In terms of rainfall, the data reveals fluctuations with some months experiencing a decrease while others show an increase. The month of March stands out with a notable decrease in rainfall of about 3.22mm. Sunshine duration also varies across months, with June witnessing a slight increase in sunshine hours while August shows a decrease. These insights highlight the dynamic nature of climate change in New Caledonia.
Climate Change Data Overview for New Caledonia, New Caledonia
Explore the comprehensive climate change data for New Caledonia, New Caledonia. This detailed table provides valuable insights into temperature variations, precipitation levels, and seasonal changes influenced by climate change, helping you understand the unique weather patterns of this region.
Temperature °C
| Month | ⌀ 1940 - 1950 | ⌀ 2013 - 2023 | +/- |
|---|---|---|---|
| Jan | 24.59 | 25.33 | 0.74 |
| Feb | 24.81 | 25.96 | 1.15 |
| Mar | 24.55 | 25.54 | 0.98 |
| Apr | 23.07 | 24.41 | 1.35 |
| May | 21.16 | 22.87 | 1.72 |
| Jun | 19.95 | 21.59 | 1.64 |
| Jul | 19.07 | 20.74 | 1.67 |
| Aug | 19.13 | 20.38 | 1.25 |
| Sep | 19.67 | 20.88 | 1.21 |
| Oct | 21.10 | 22.15 | 1.06 |
| Nov | 22.26 | 23.38 | 1.13 |
| Dec | 23.82 | 24.71 | 0.89 |
| ⌀ Month | 21.93 | 23.16 | 1.23 |
Sunshine (h)
| Month | ⌀ 1940 - 1950 | ⌀ 2013 - 2023 | +/- |
|---|---|---|---|
| Jan | 10.49 | 10.47 | -0.01 |
| Feb | 10.29 | 10.29 | 0.01 |
| Mar | 9.67 | 9.91 | 0.24 |
| Apr | 8.88 | 9.01 | 0.13 |
| May | 9.28 | 8.43 | -0.86 |
| Jun | 8.35 | 8.52 | 0.17 |
| Jul | 9.07 | 8.53 | -0.55 |
| Aug | 9.13 | 8.84 | -0.29 |
| Sep | 9.82 | 9.93 | 0.11 |
| Oct | 11.07 | 10.55 | -0.53 |
| Nov | 11.80 | 11.20 | -0.60 |
| Dec | 11.24 | 10.84 | -0.41 |
| ⌀ Month | 9.92 | 9.71 | -0.21 |
Rain (mm)
| Month | ⌀ 1940 - 1950 | ⌀ 2013 - 2023 | +/- |
|---|---|---|---|
| Jan | 8.12 | 7.54 | -0.58 |
| Feb | 8.39 | 8.45 | 0.06 |
| Mar | 9.25 | 6.03 | -3.22 |
| Apr | 6.01 | 7.94 | 1.93 |
| May | 3.19 | 3.14 | -0.05 |
| Jun | 3.55 | 3.05 | -0.50 |
| Jul | 2.05 | 2.55 | 0.51 |
| Aug | 2.71 | 3.11 | 0.40 |
| Sep | 3.36 | 1.94 | -1.42 |
| Oct | 3.30 | 2.92 | -0.38 |
| Nov | 3.49 | 3.03 | -0.46 |
| Dec | 4.42 | 5.52 | 1.09 |
| ⌀ Month | 4.82 | 4.60 | -0.22 |
Snow (mm)
| Month | ⌀ 1940 - 1950 | ⌀ 2013 - 2023 | +/- |
|---|---|---|---|
| Jan | 0.00 | 0.00 | 0.00 |
| Feb | 0.00 | 0.00 | 0.00 |
| Mar | 0.00 | 0.00 | 0.00 |
| Apr | 0.00 | 0.00 | 0.00 |
| May | 0.00 | 0.00 | 0.00 |
| Jun | 0.00 | 0.00 | 0.00 |
| Jul | 0.00 | 0.00 | 0.00 |
| Aug | 0.00 | 0.00 | 0.00 |
| Sep | 0.00 | 0.00 | 0.00 |
| Oct | 0.00 | 0.00 | 0.00 |
| Nov | 0.00 | 0.00 | 0.00 |
| Dec | 0.00 | 0.00 | 0.00 |
| ⌀ Month | 0.00 | 0.00 | 0.00 |